Just under 20 million residents of the United States are veterans of America’s armed forces, and while about 42% are over the age of 65, the majority are working-age adults. Re-entering civilian life after military service can be a challenge, from becoming reintegrated into the family unit to adjusting to culture changes.
Among the more difficult issues with re-entry is finding a rewarding new career path. In fact, a four-city survey conducted in 2017 at the USC Suzanne Dworak-Peck School of Social Work indicated that the most commonly cited issue with adjusting to life after the military was no longer having a job once service ended.
The unemployment rate for veterans was 2.8% in December 2019, the most recent month for which data was available, according to the U.S. Bureau of Labor Statistics. In that same month, the rate for nonveterans was slightly higher, 3.3%.
Veterans’ unemployment levels today represent a dramatic shift from the depths of the Great Recession, when overall veteran joblessness hovered between 8.5% and 10% and unemployment among Iraq and Afghanistan veterans was in the 13%-15% range. A slate of new legislation, nonprofit groups and other efforts were soon introduced to tackle the burgeoning unemployment crisis among young veterans.
And while there’s been obvious success (veterans’ unemployment fell by more than 300% between January 2011 and December 2019), the thread of success on the national level doesn’t necessarily weave through all the states, and certain areas of the country are better for veterans when it comes to getting a good job.
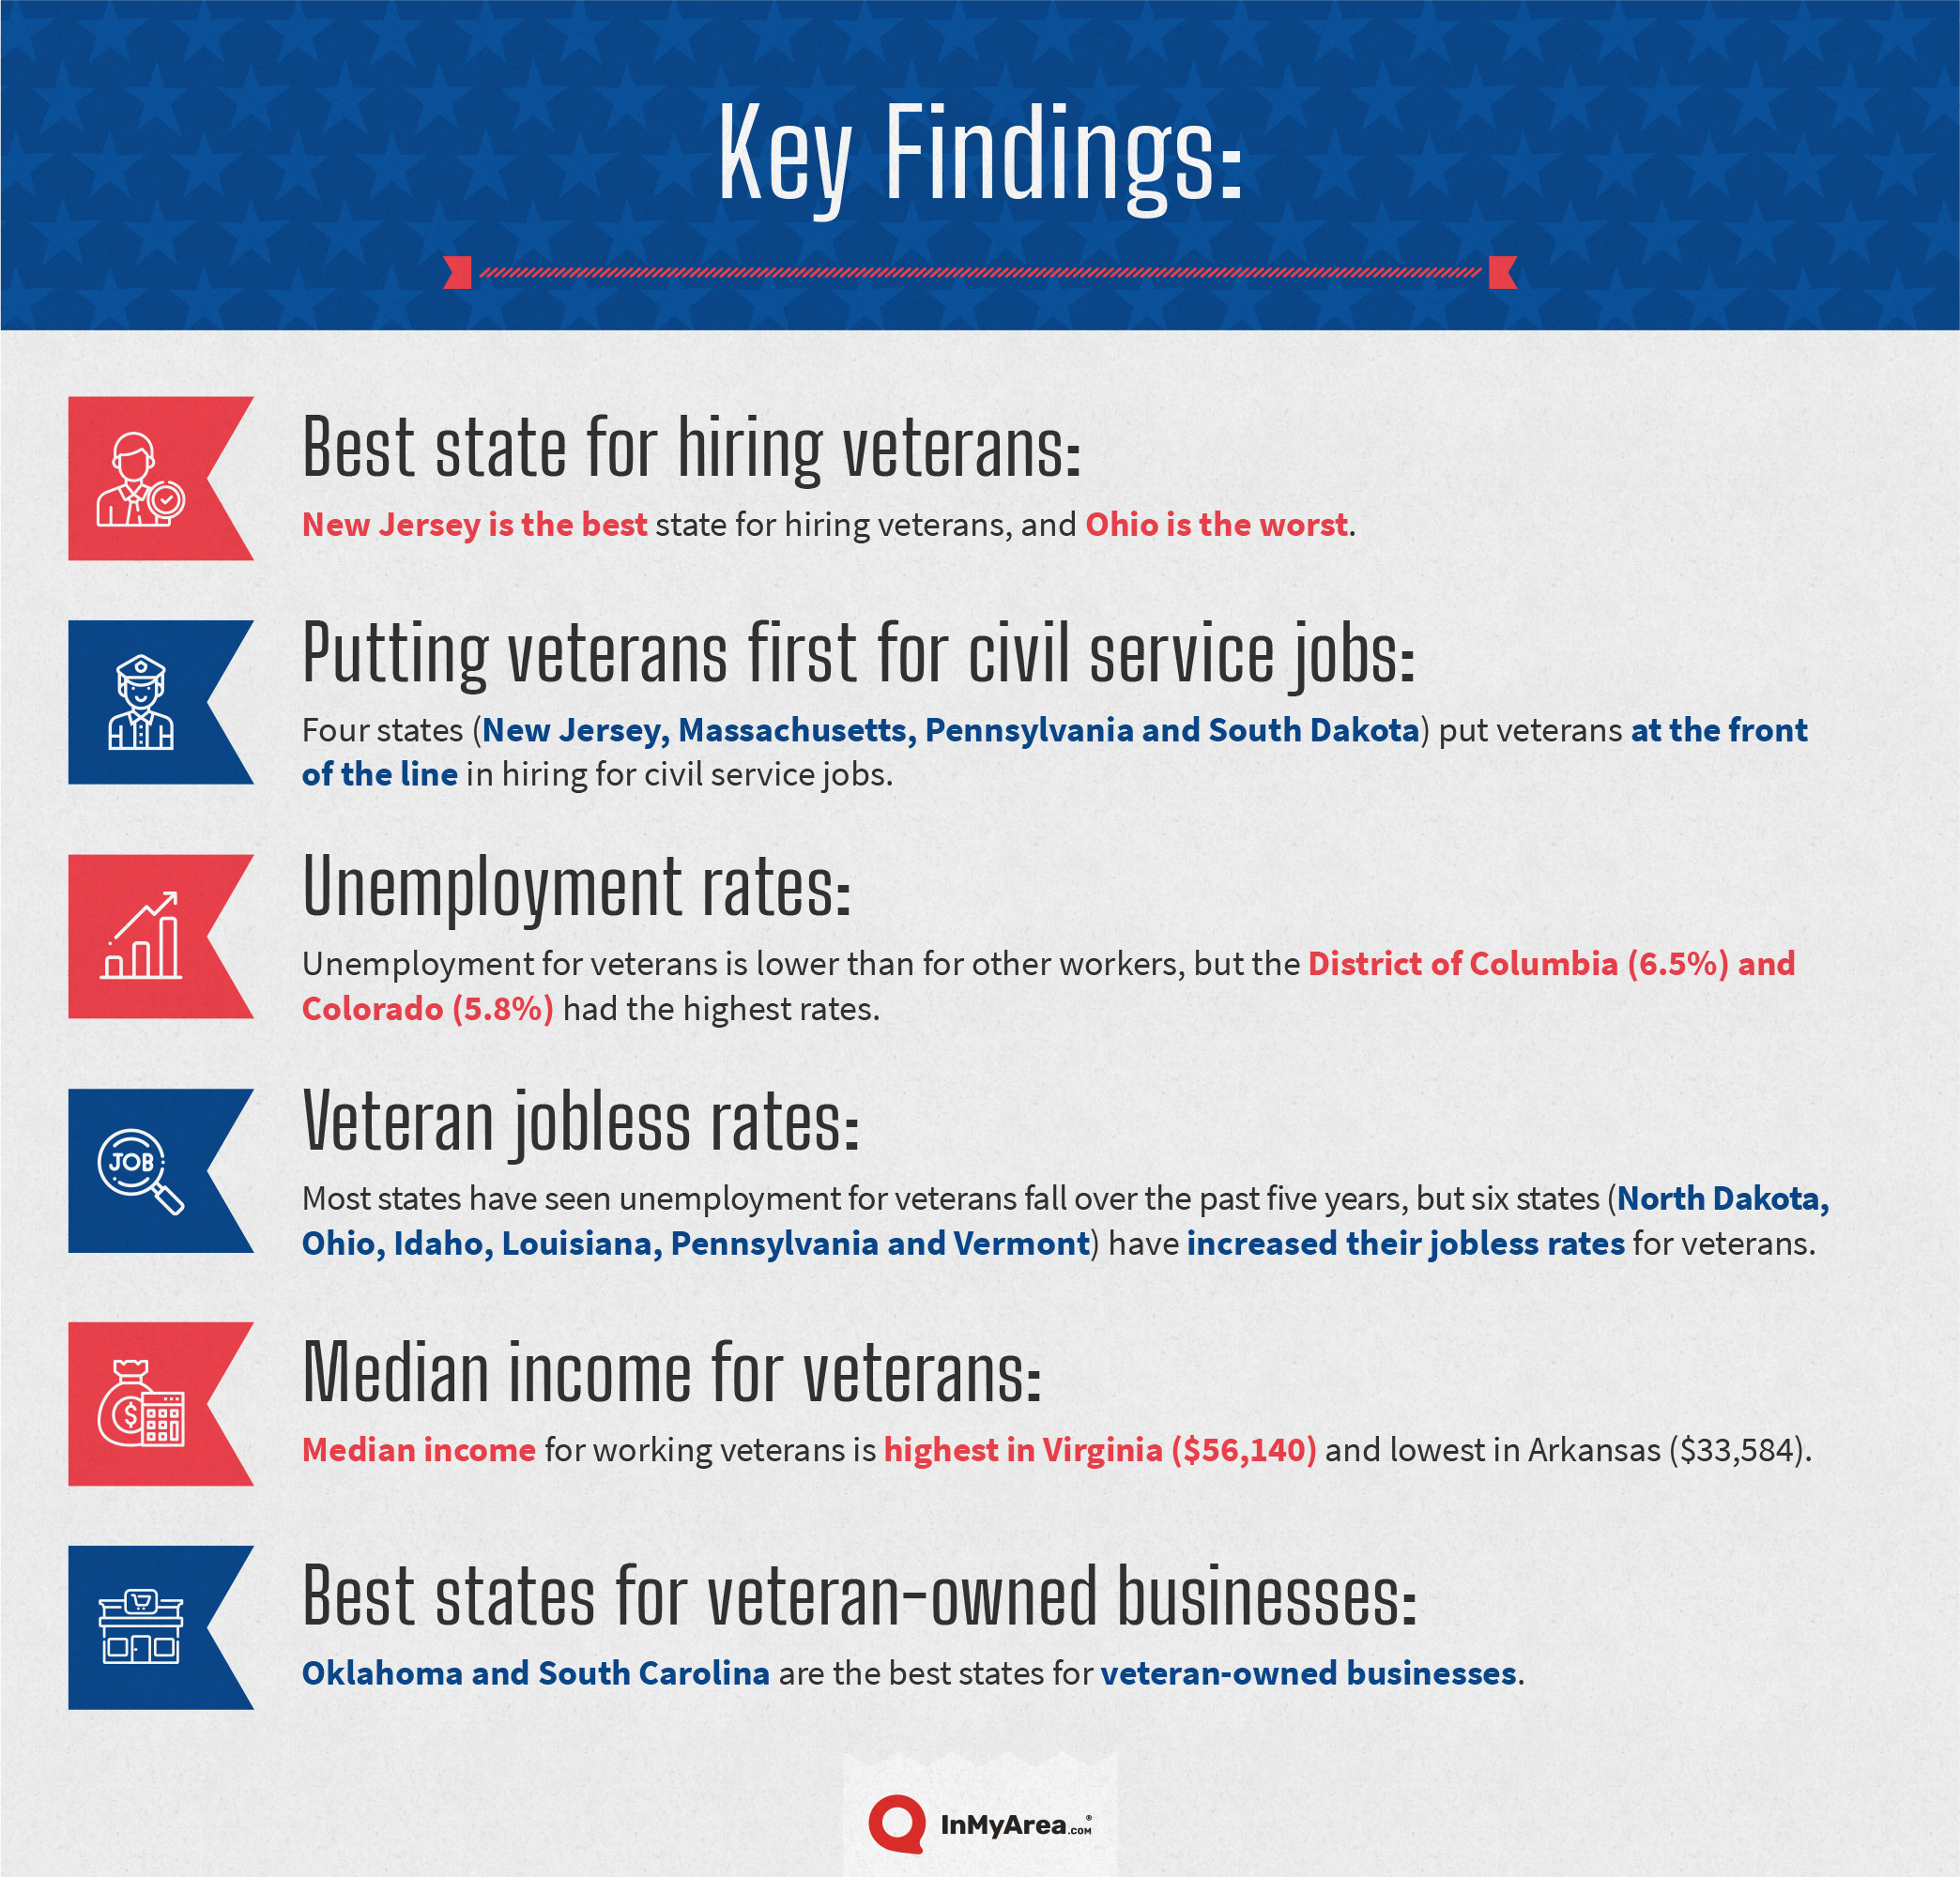
We wanted to better understand the differences that exist on the state level in the hiring of veterans, so we compared each state across a half-dozen specific categories, including government hiring practices, unemployment rates, median income, veteran business ownership and job training investment per veteran. You can jump to the bottom of the page to see the complete methodology of our study, but here are some interesting highlights of our research findings:
Best & Worst States
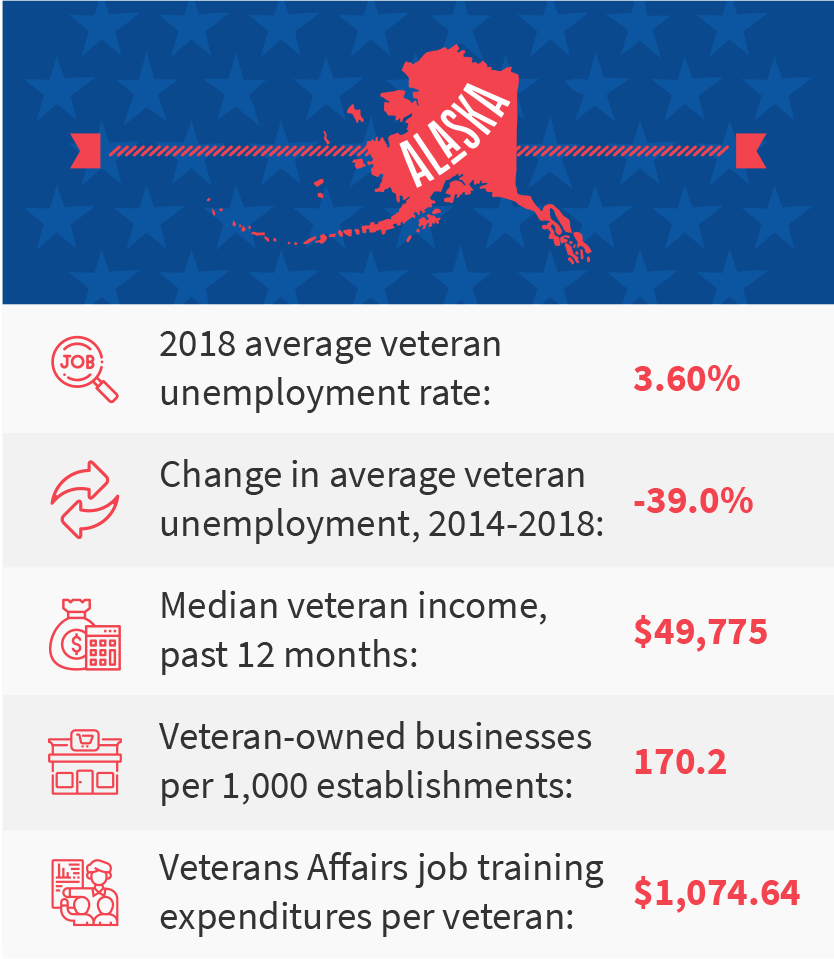
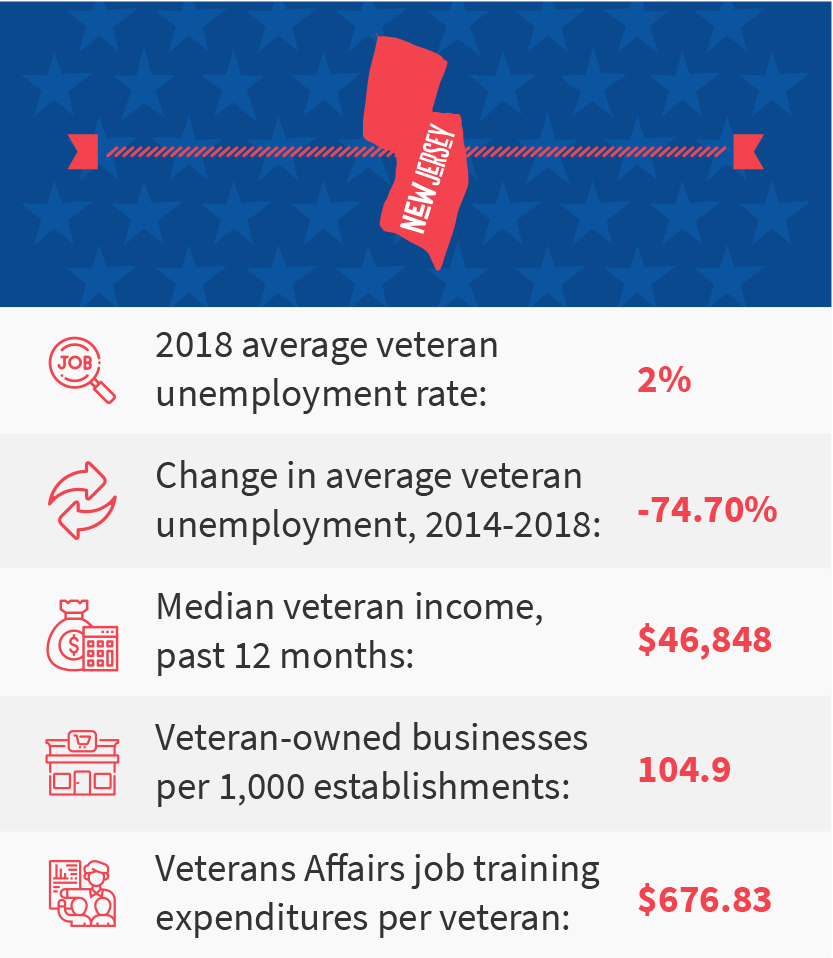
According to our analysis, the best state for hiring veterans is New Jersey, which had a total score that was 35 points higher than the next-highest scoring states (a tie between Alaska and Virginia).
The only category in the ranking for which New Jersey was not among the top third of states was the number of veteran-owned businesses relative to all establishments in the state, and New Jersey was first or second-best in three categories and in the top 10 in another.
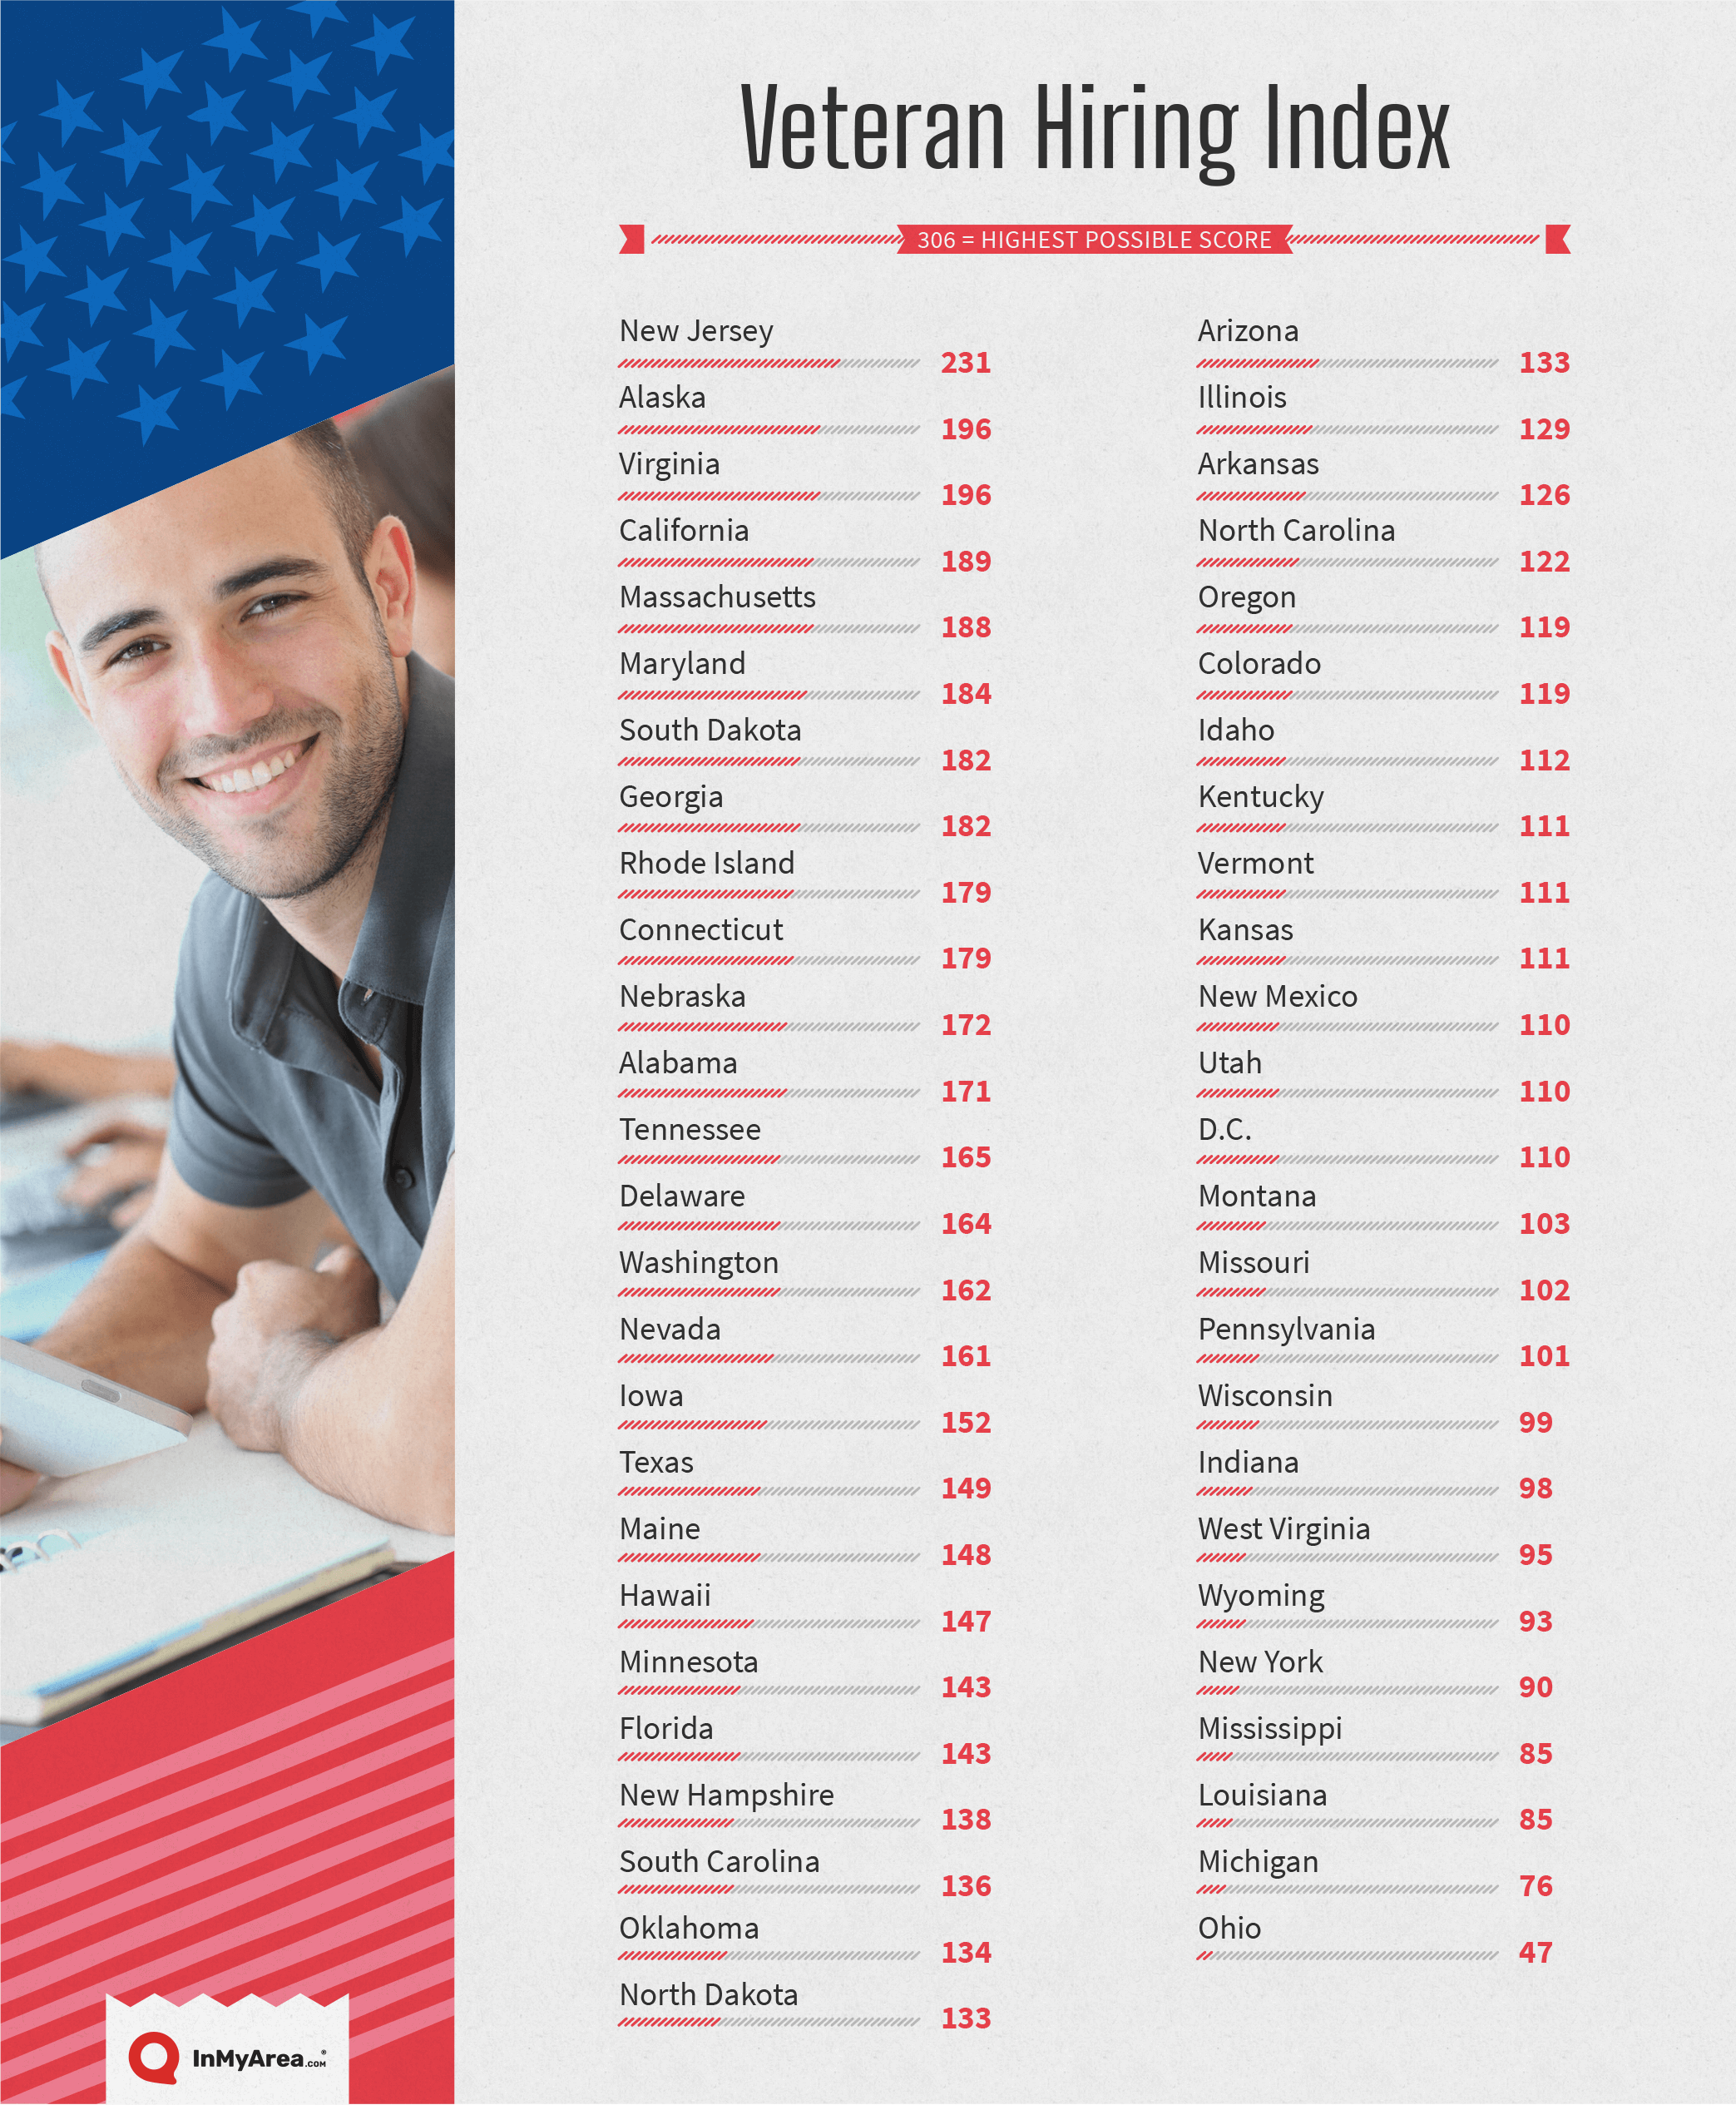
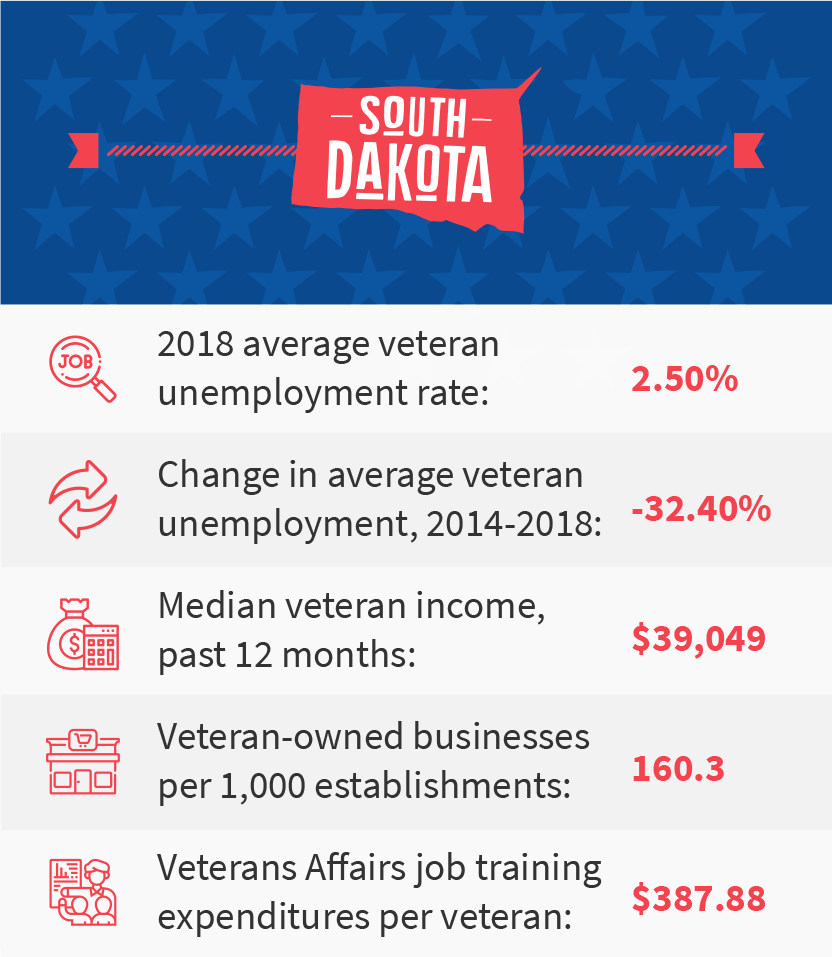
All four geographic regions of the U.S. are represented by at least one state in the top 10, while the Northeast has the highest number of states at the top of the list, four total, followed by the South with three and the West with two. South Dakota is the only Midwestern state in the top 10, though Nebraska is close.
The number of states in the top 10 by region also predicts the overall score per region, with the Northeast having the highest score by a considerable margin.
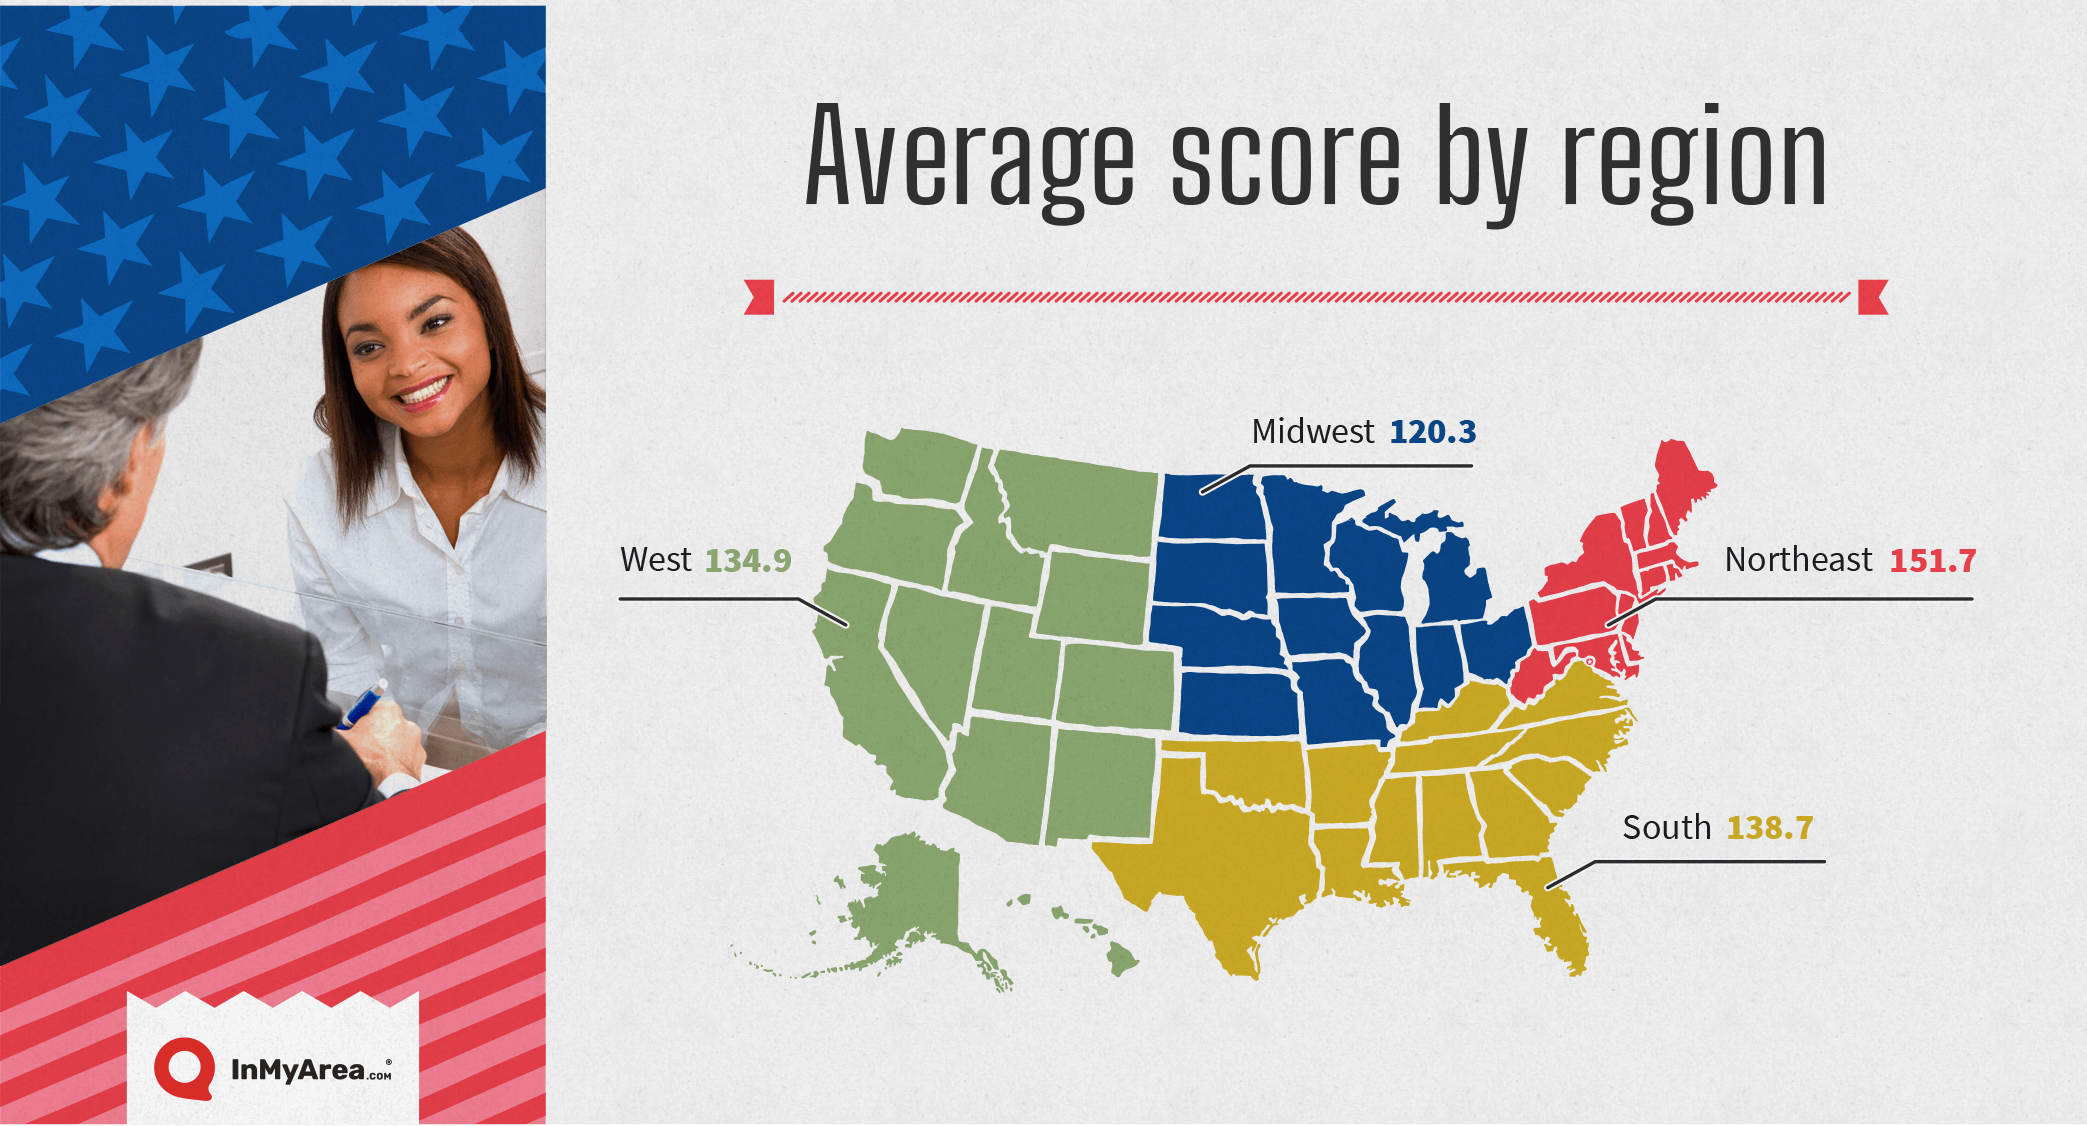
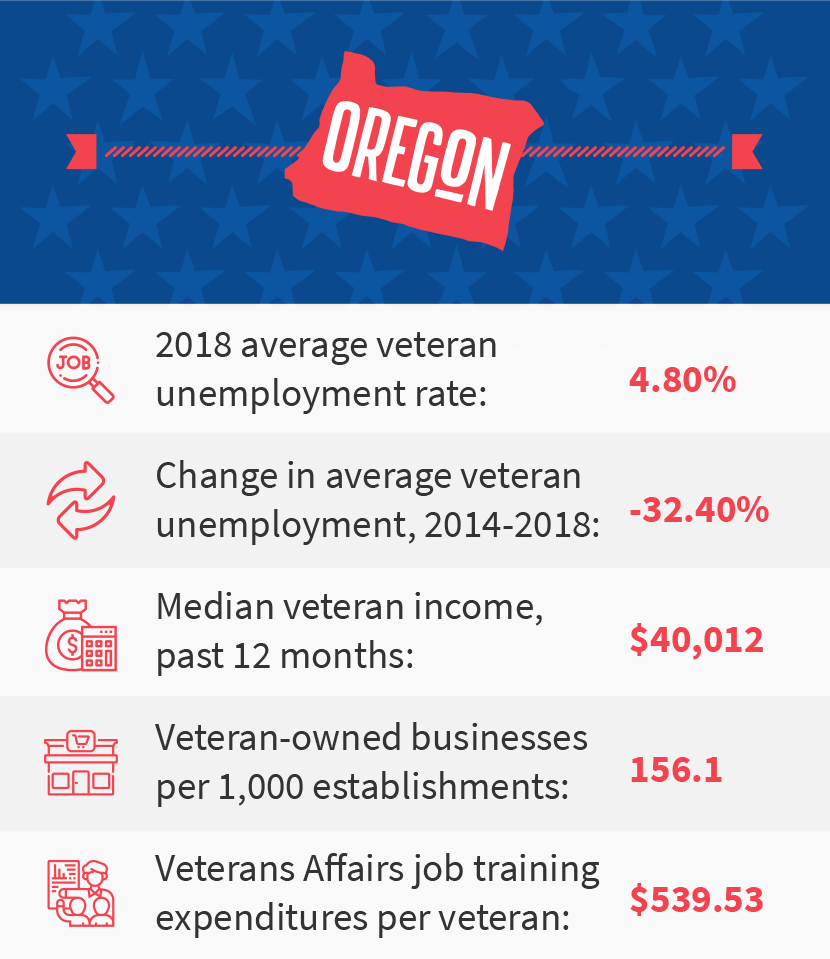
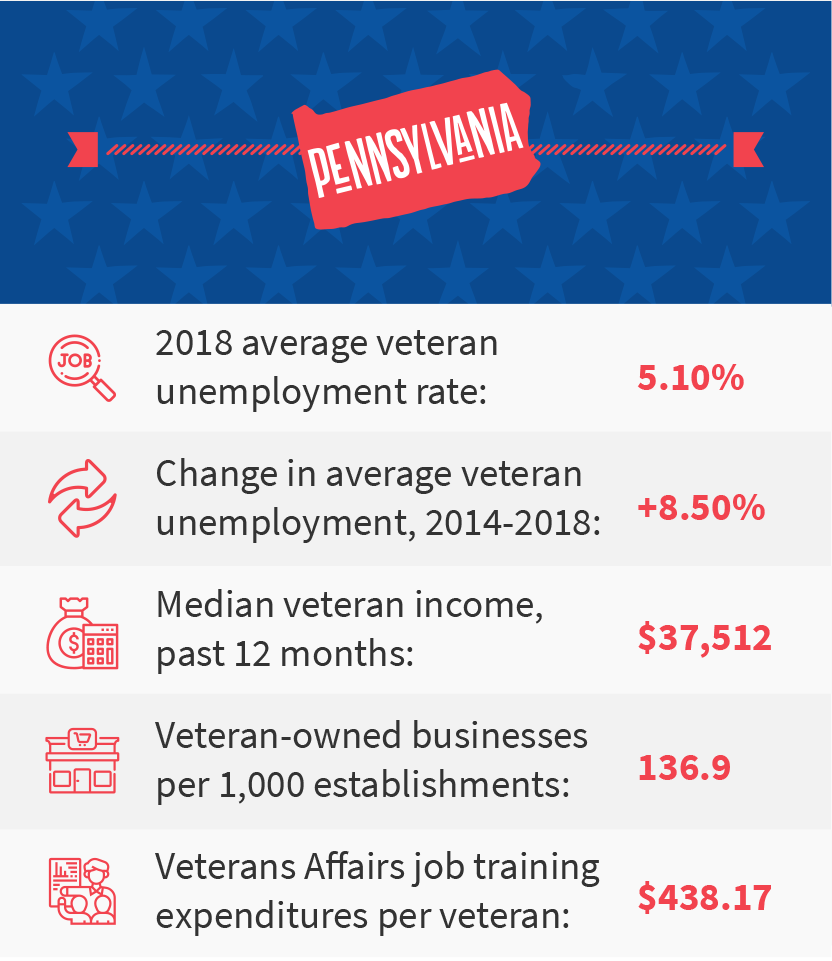
At the other end of the spectrum, four of the 10 states with the lowest scores are in the Midwest, and Pennsylvania, despite being one of only four states with an absolute hiring preference for veterans in state jobs (more on that in the next section) is in the bottom 10 due mostly to poor scores in every other category.
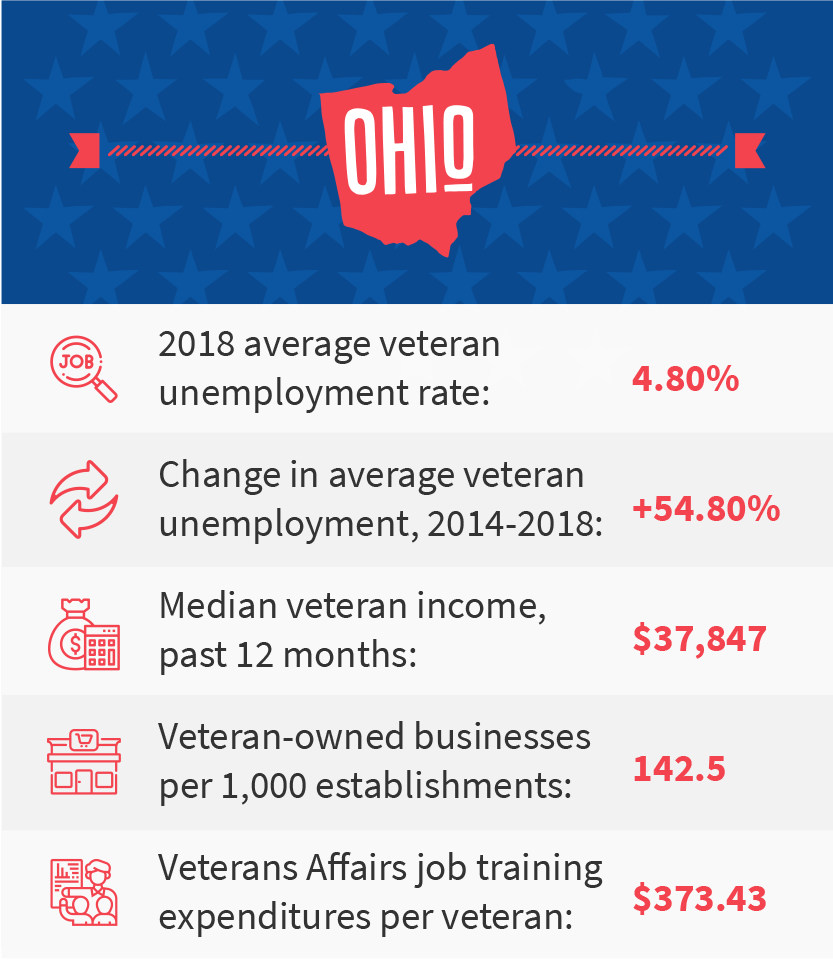
Ohio has the worst score among all states and placed out of the bottom quarter in only two categories (veteran-owned businesses and income). Ohio was among the 10 worst in every other category.
Read on for a category-by-category summary and look at which states were best (and worst) in each.
Hiring Policies
The Veterans’ Preference Act of 1944 first established the use of preferential hiring of veterans for federal government jobs, and in the 75-plus years since it became law, a scoring advantage for veterans has extended from federal government jobs to the state level.
Most states use a points system that mirrors the one in use at the federal level for jobs that require a civil service test. The system assigns varying numerical points based on a veterans’ service. This includes things like 5 points for service during a war or 10 points for being awarded a Purple Heart. These points don’t guarantee jobs for veterans at the state level, but several states give veterans a much more aggressive edge in hiring.
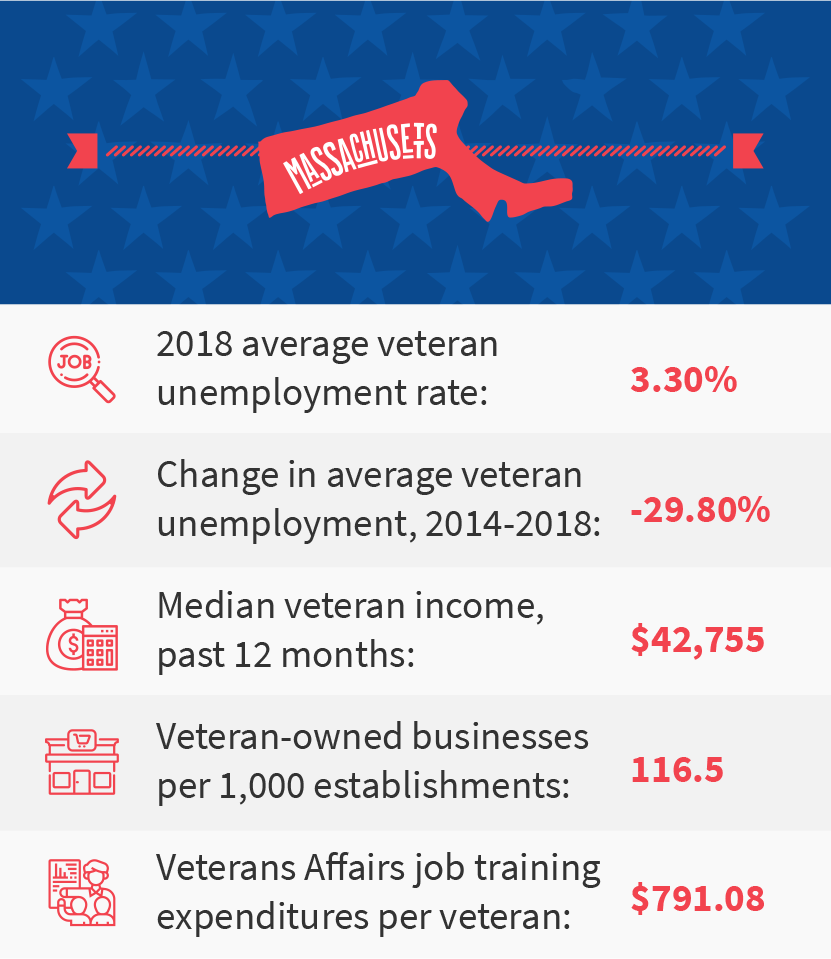
Massachusetts, New Jersey, Pennsylvania and South Dakota assign veterans absolute preference, which means that applicants who pass their civil service tests will leapfrog other applicants, even if veterans appear less qualified.
In the case of our ranking, absolute preference proved a huge influence for three of the four states, as New Jersey (No. 1), Massachusetts (No. 5) and South Dakota (No. 7) all placed in the top 10. As referenced, Pennsylvania scored in the bottom 10 despite using an absolute-preference model for veterans.
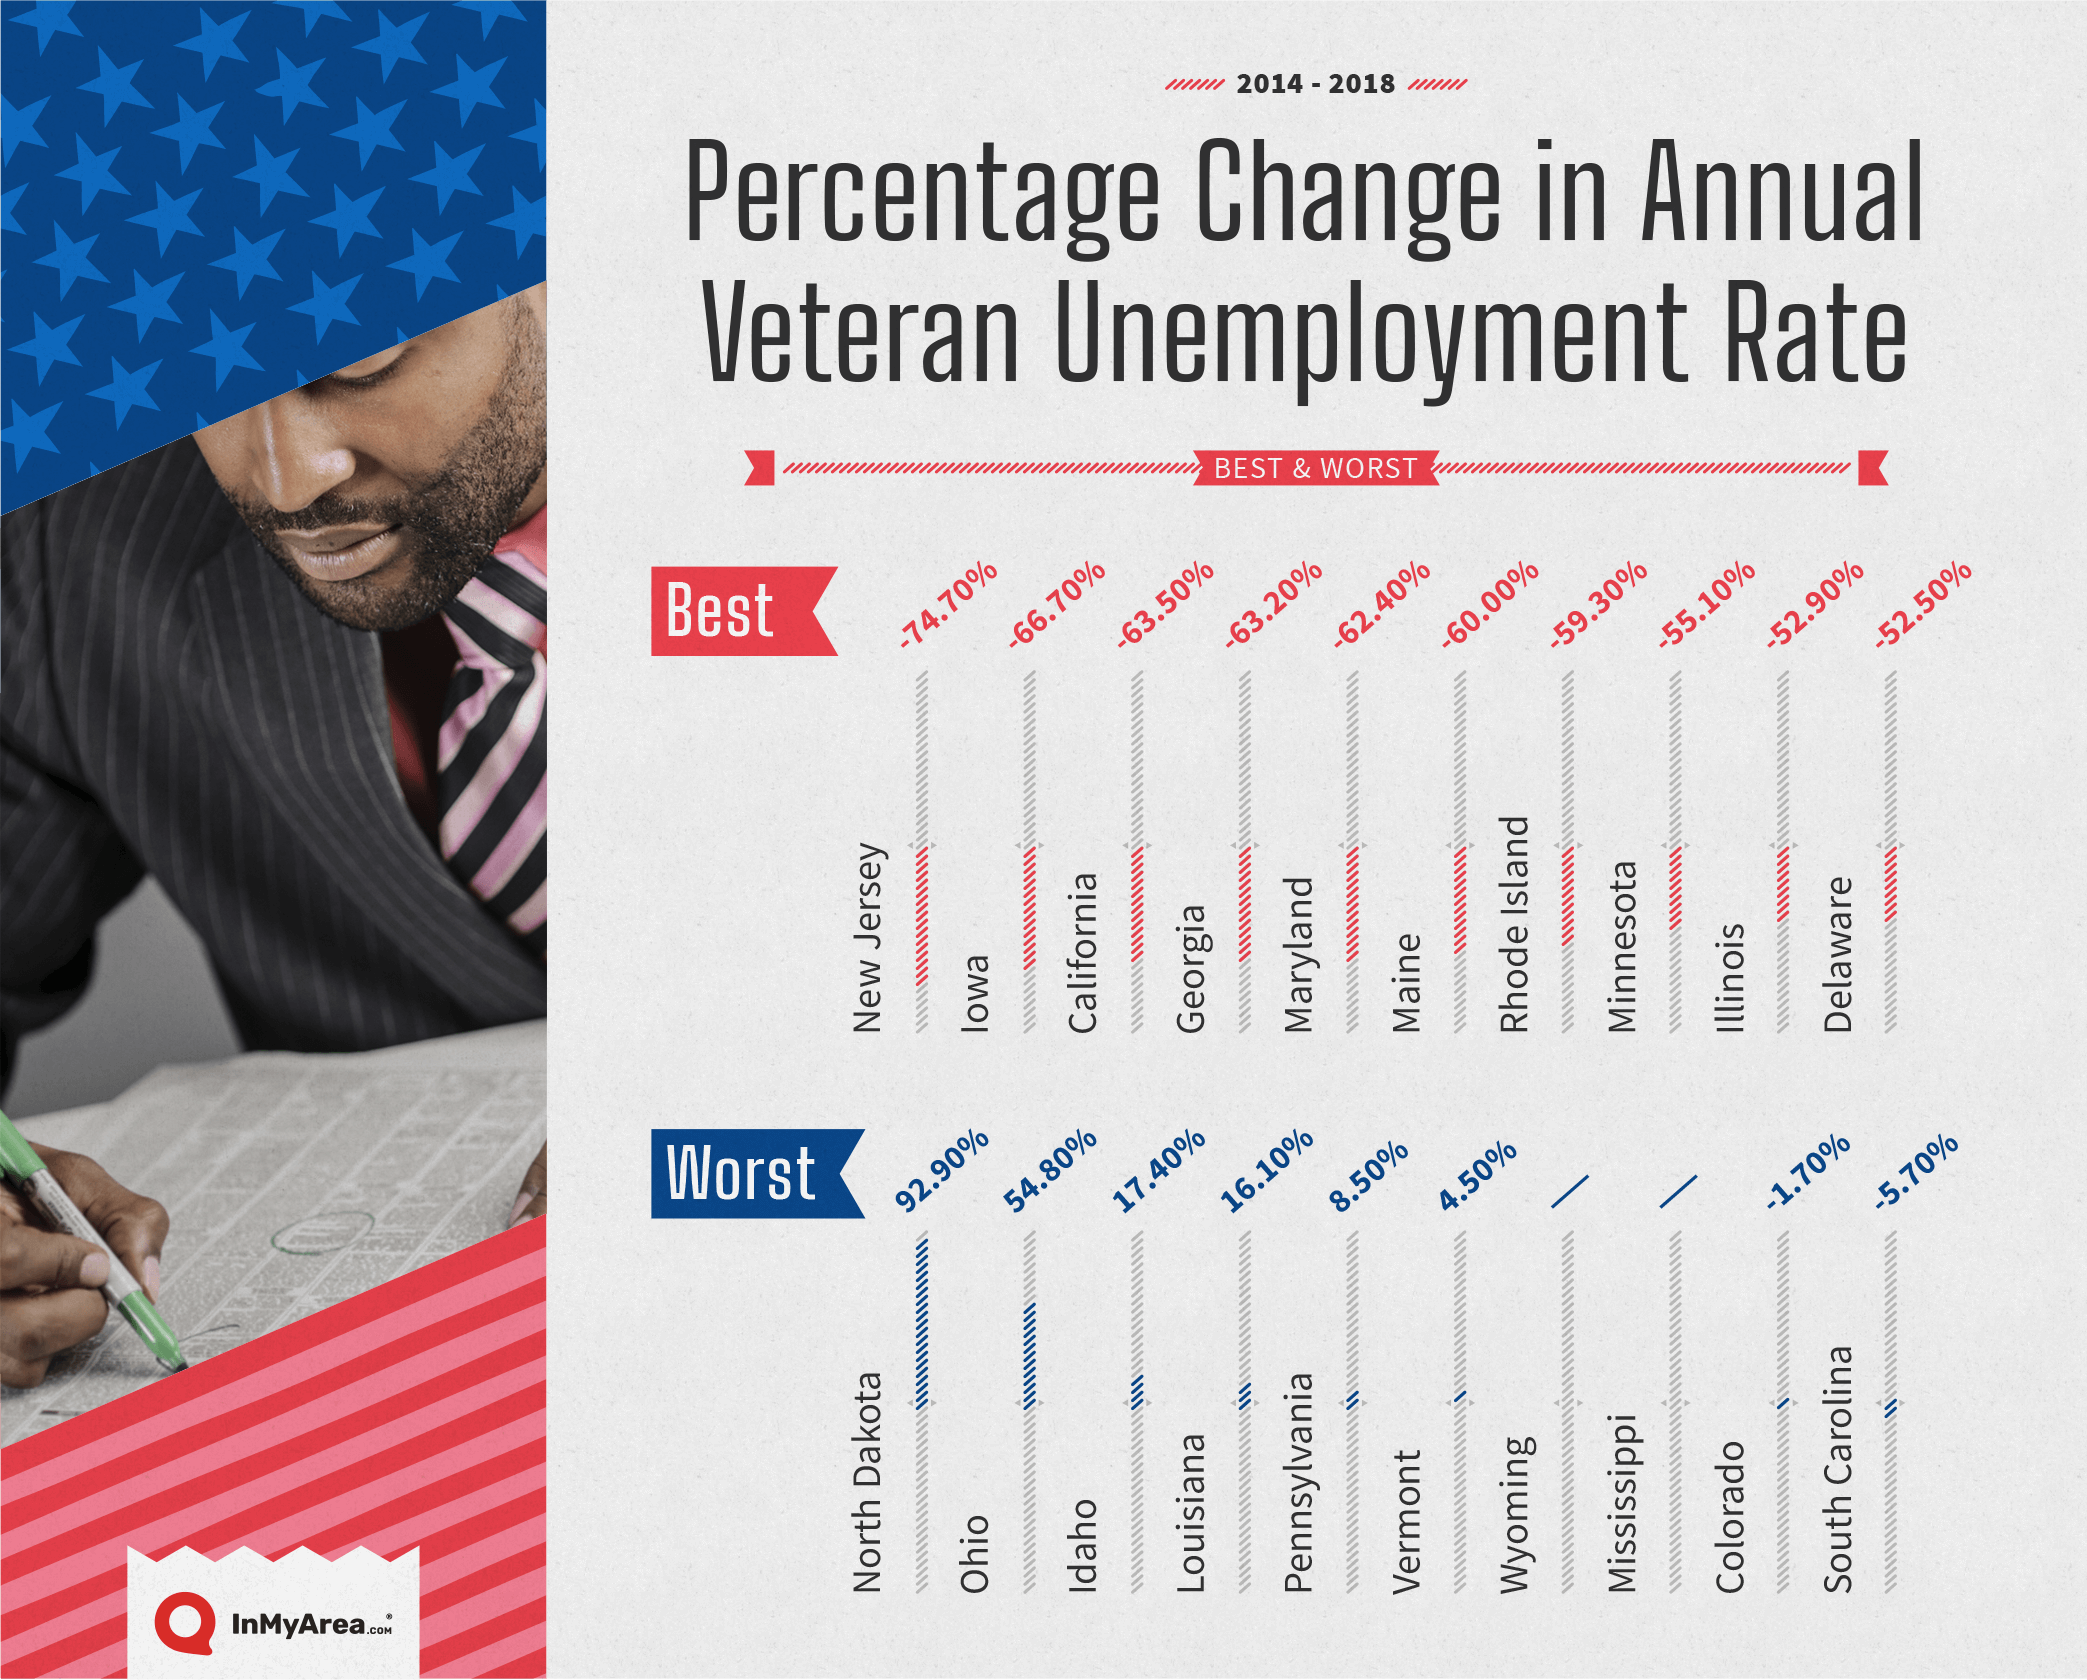
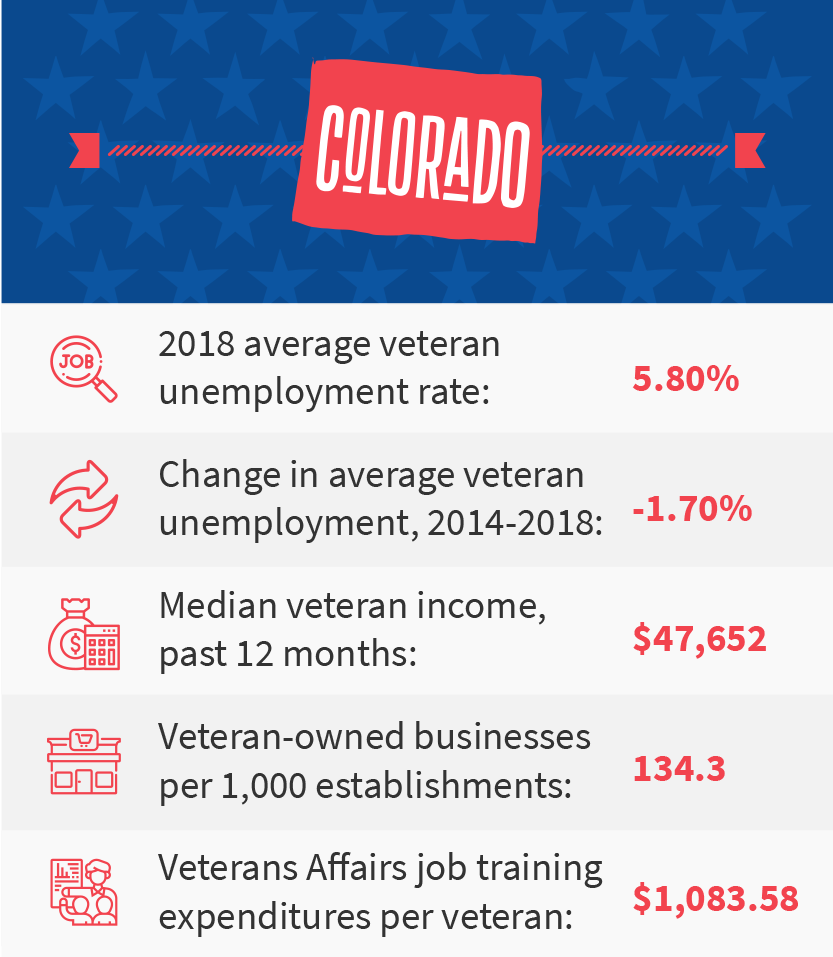
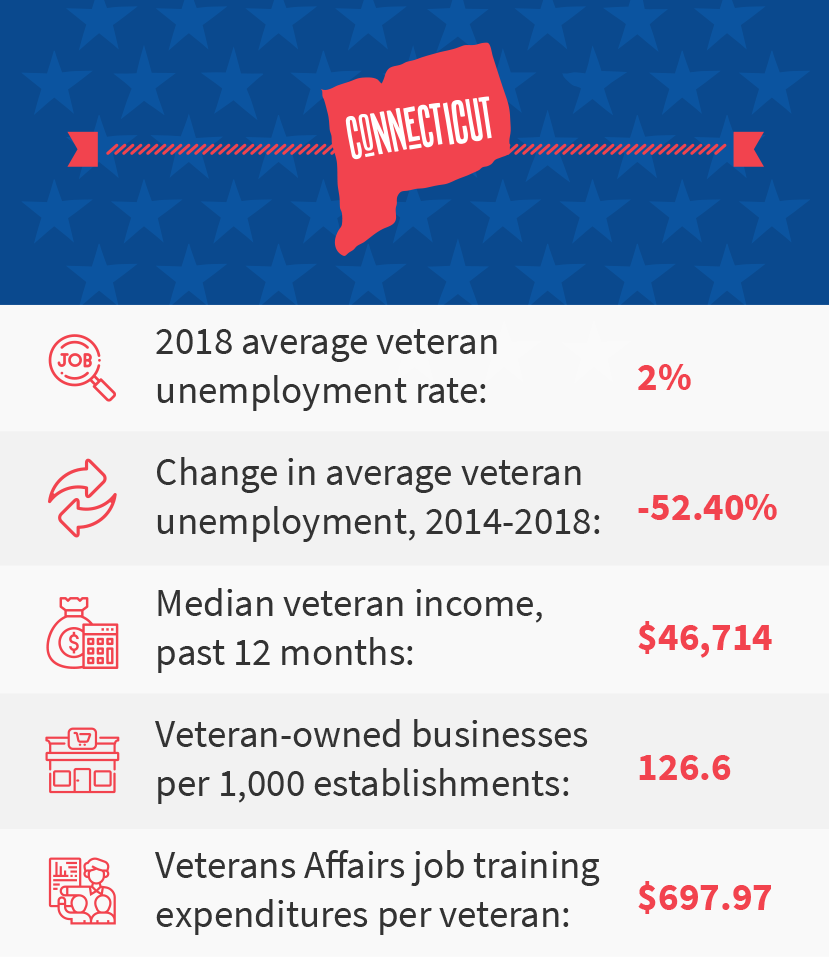
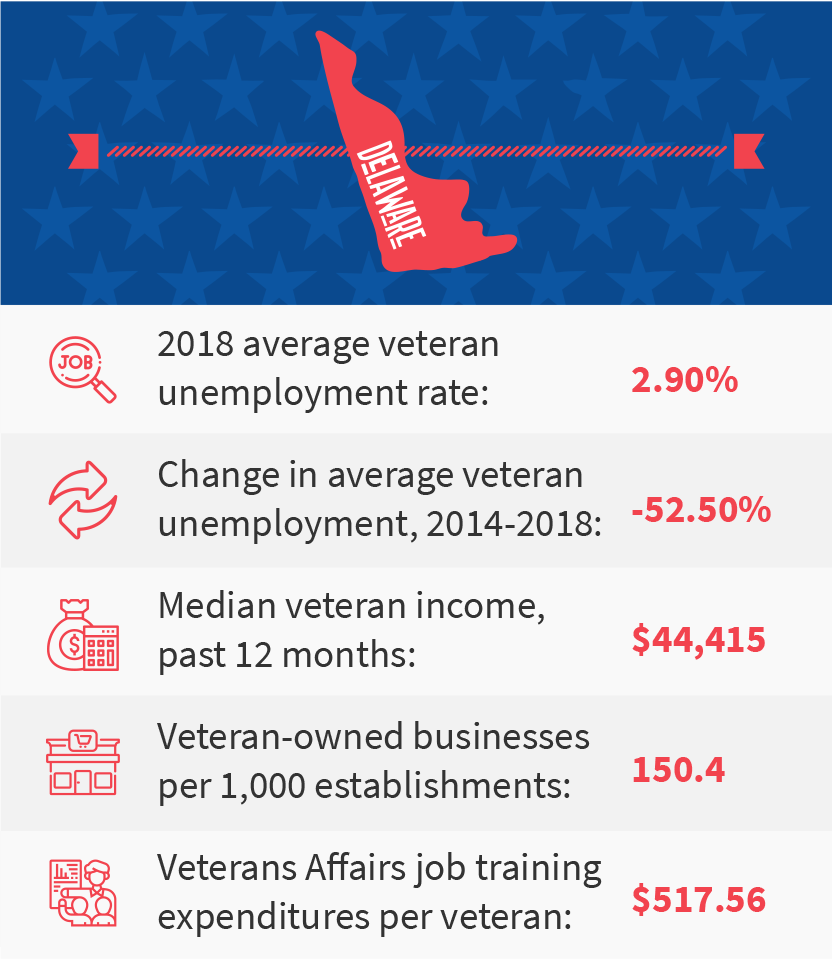
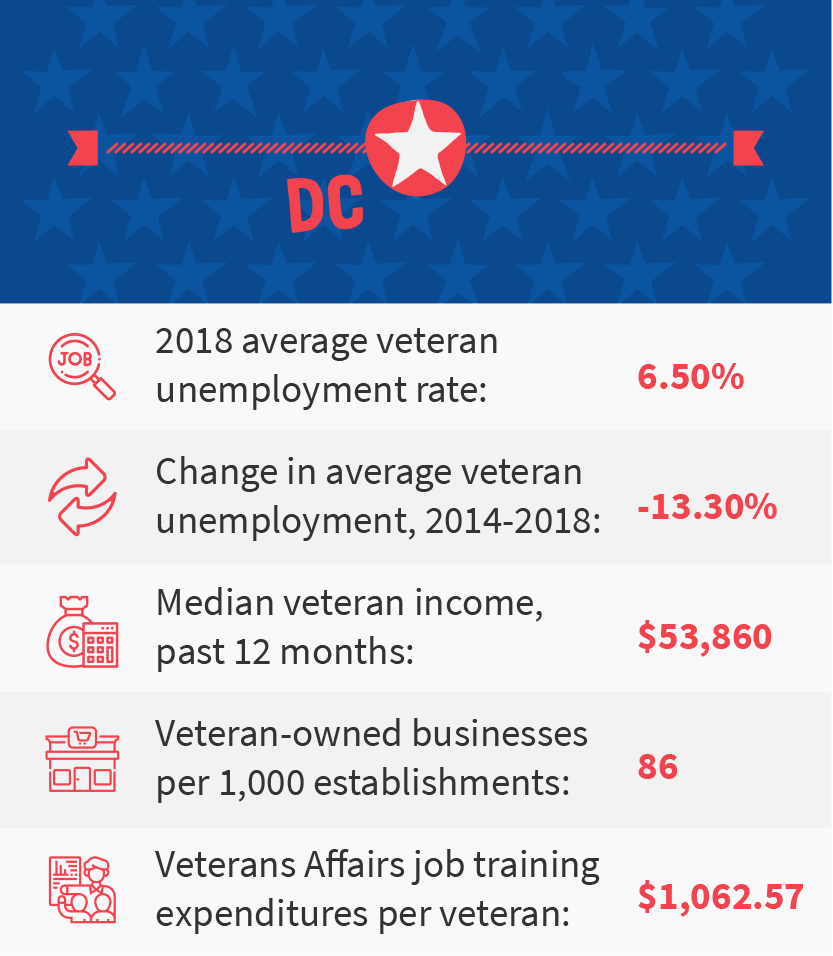
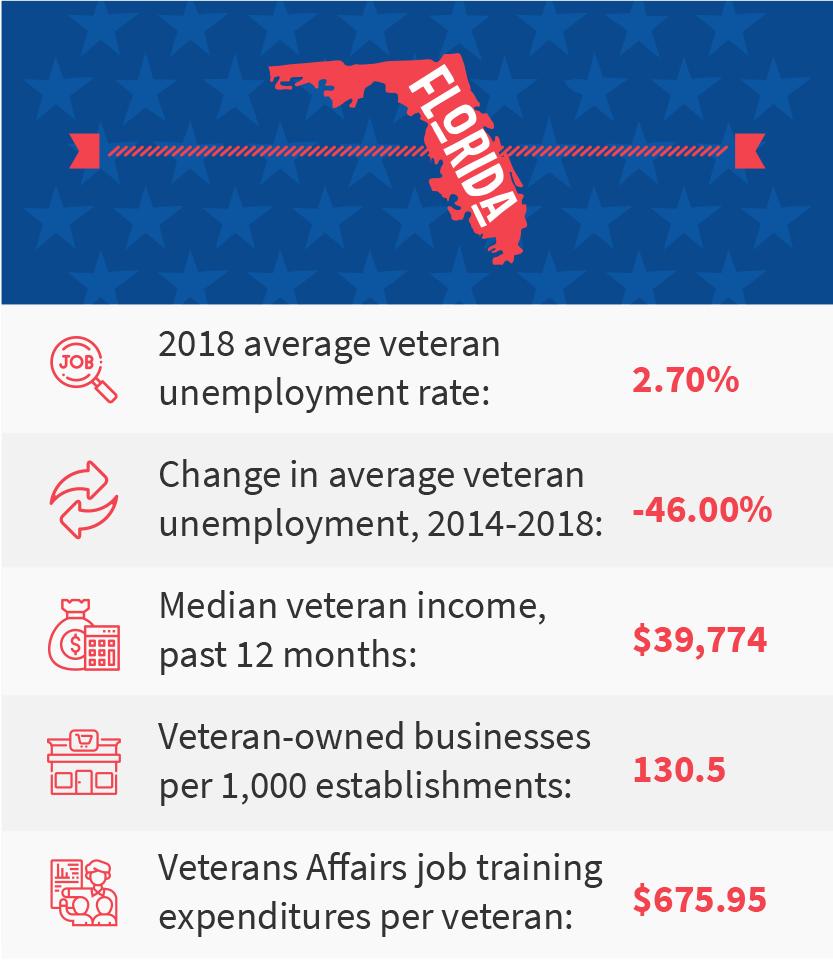
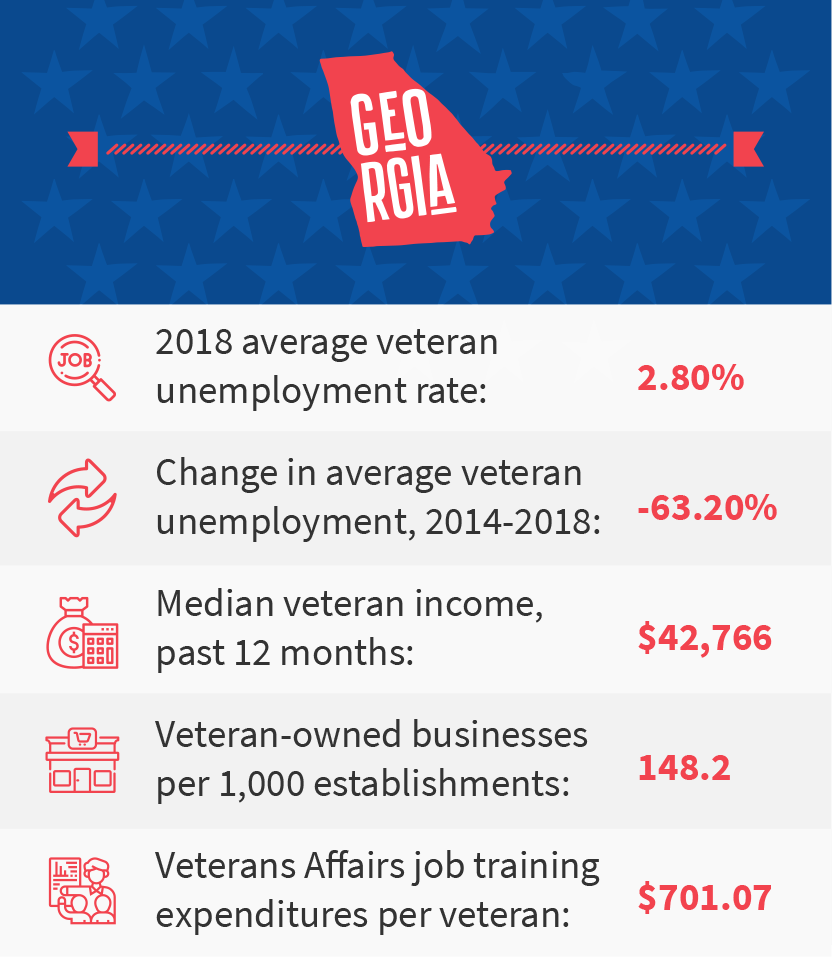
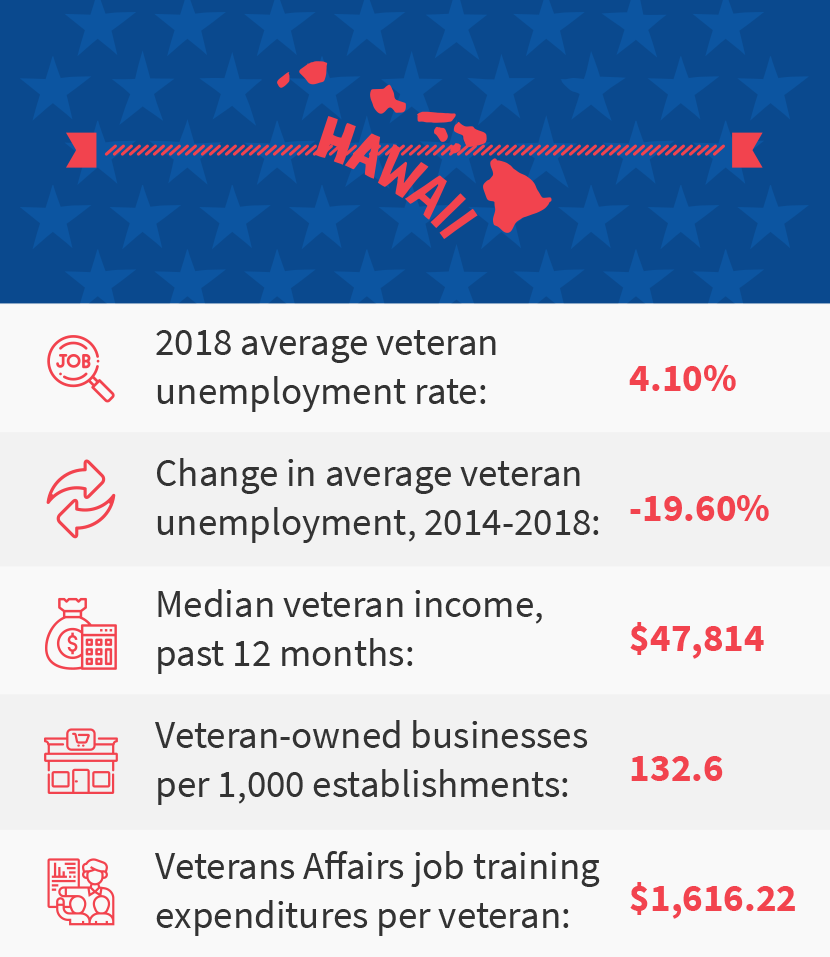
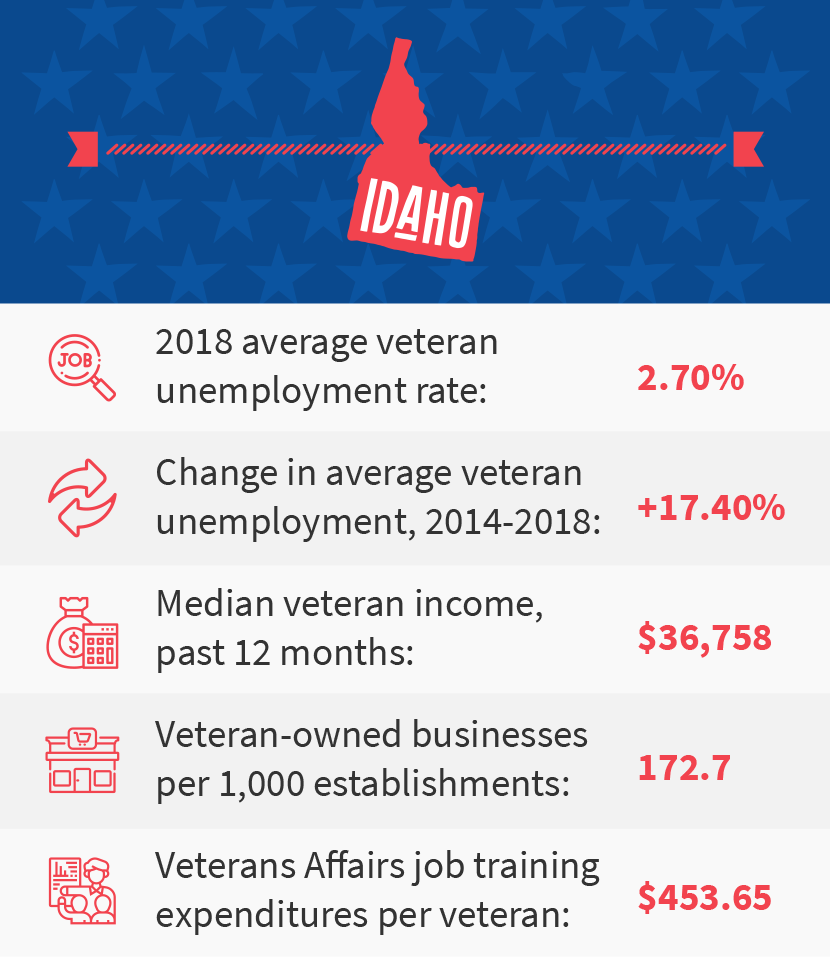
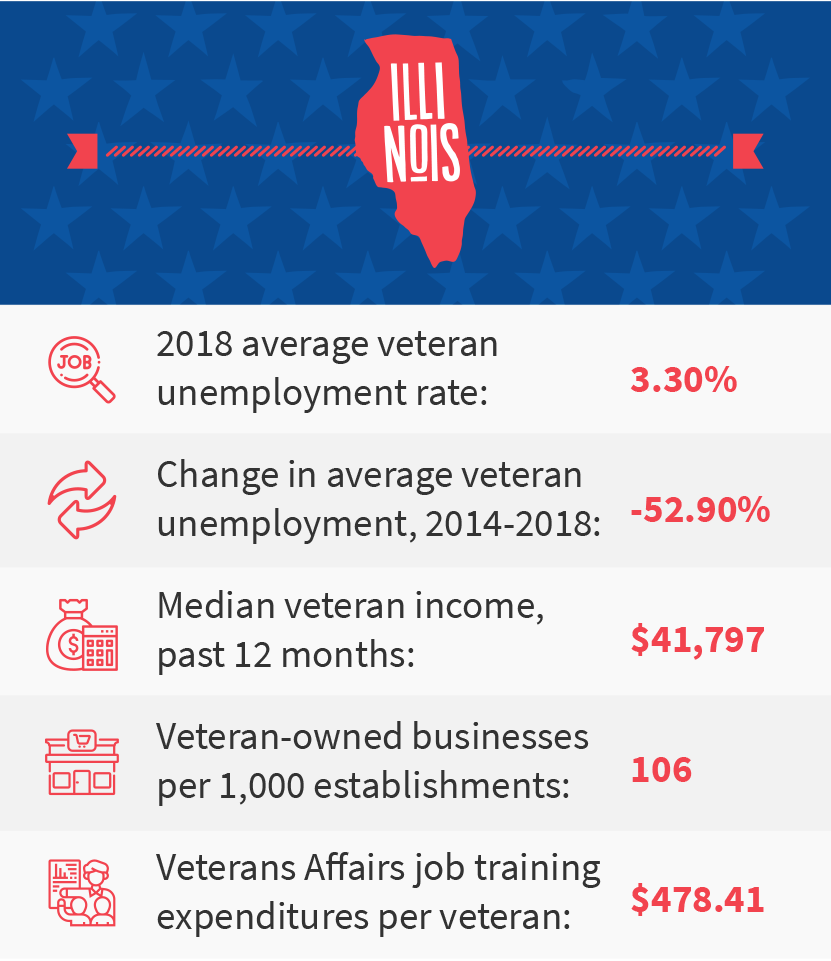
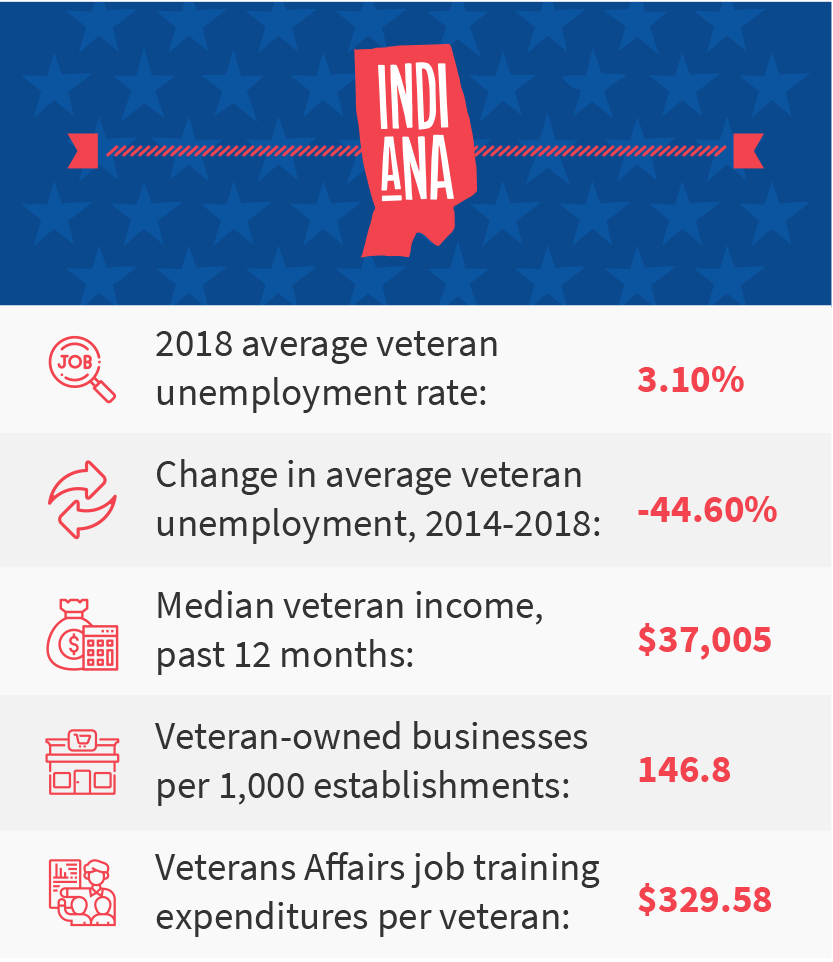
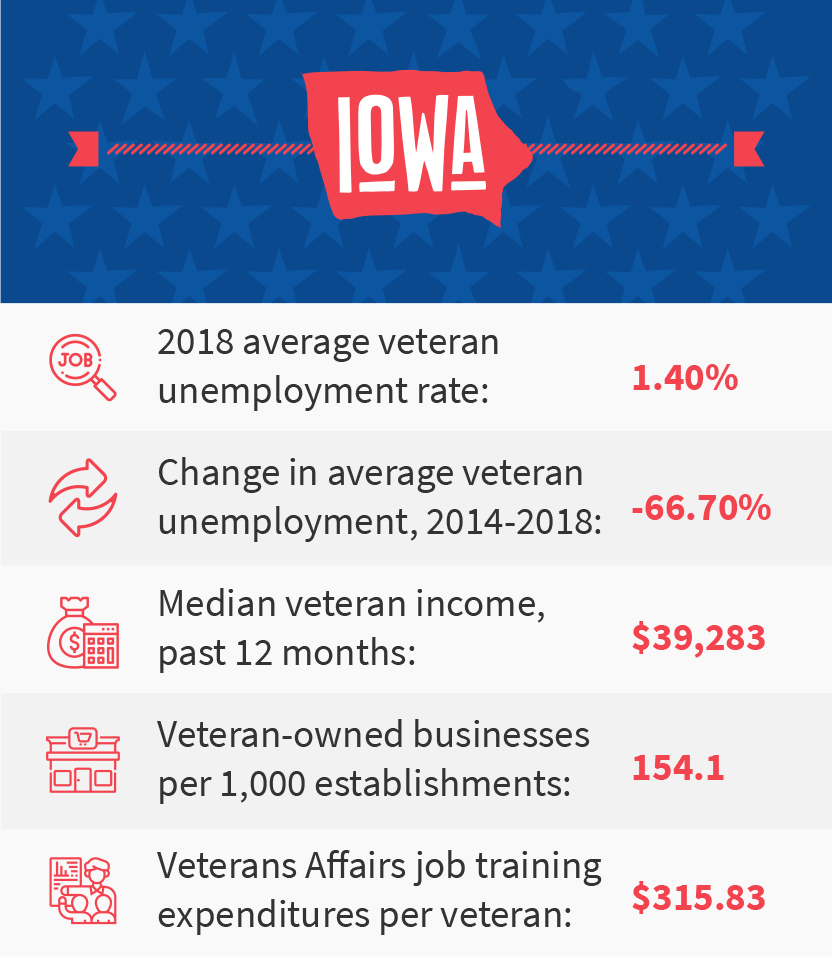
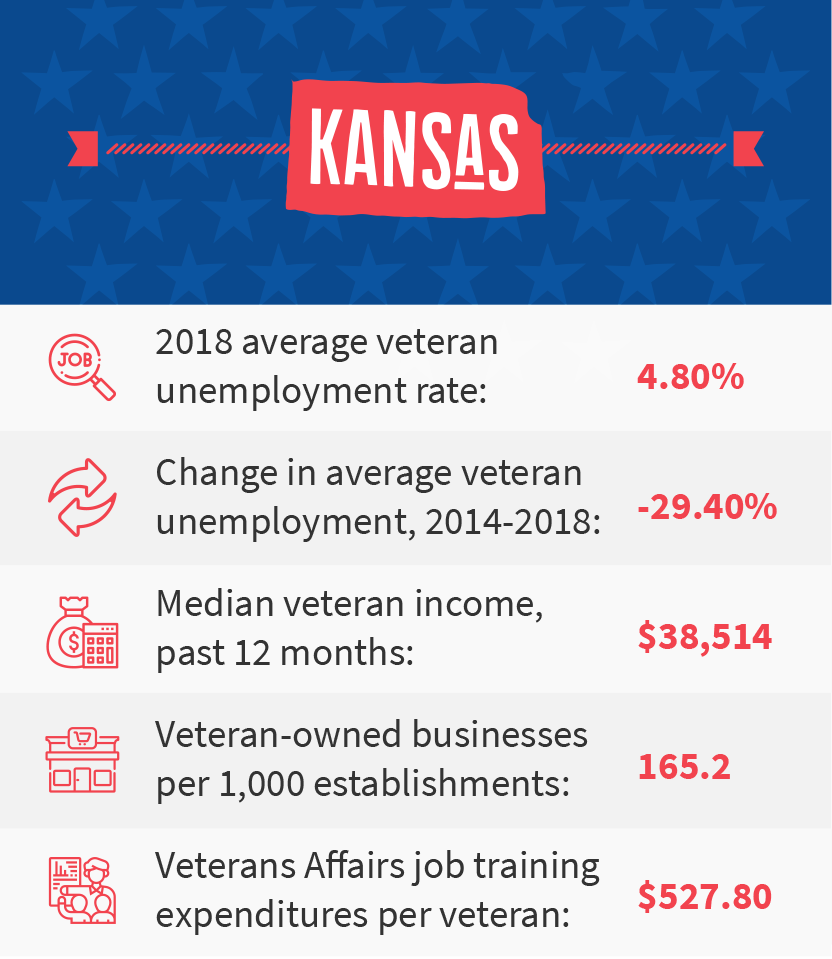
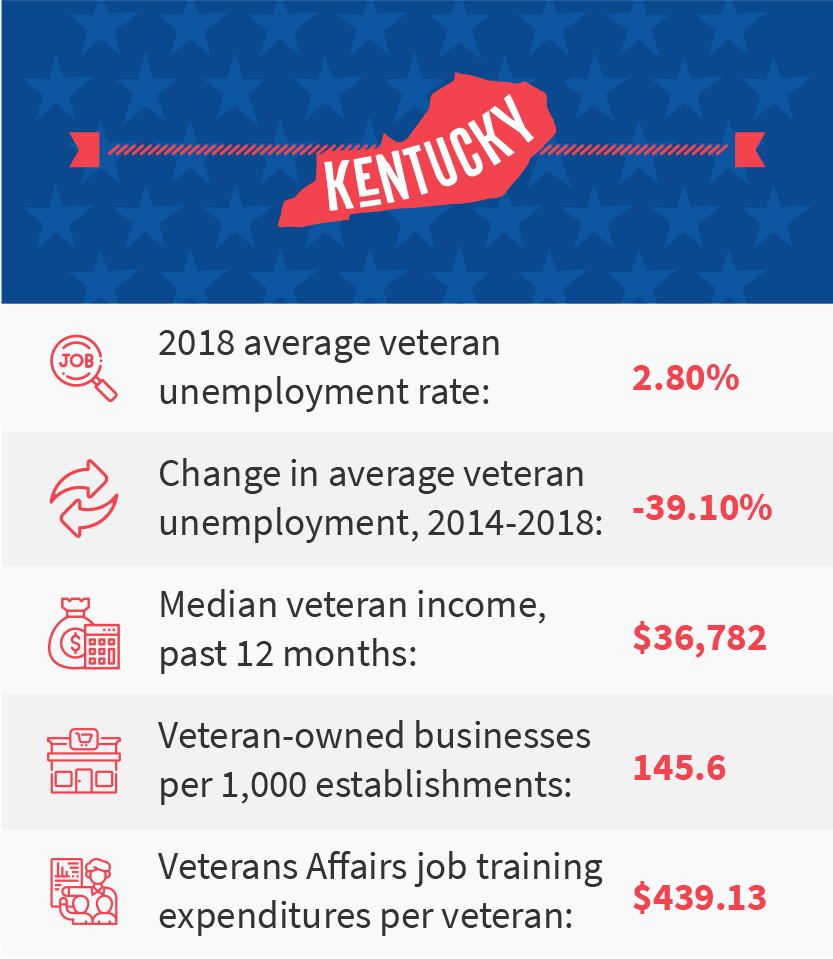
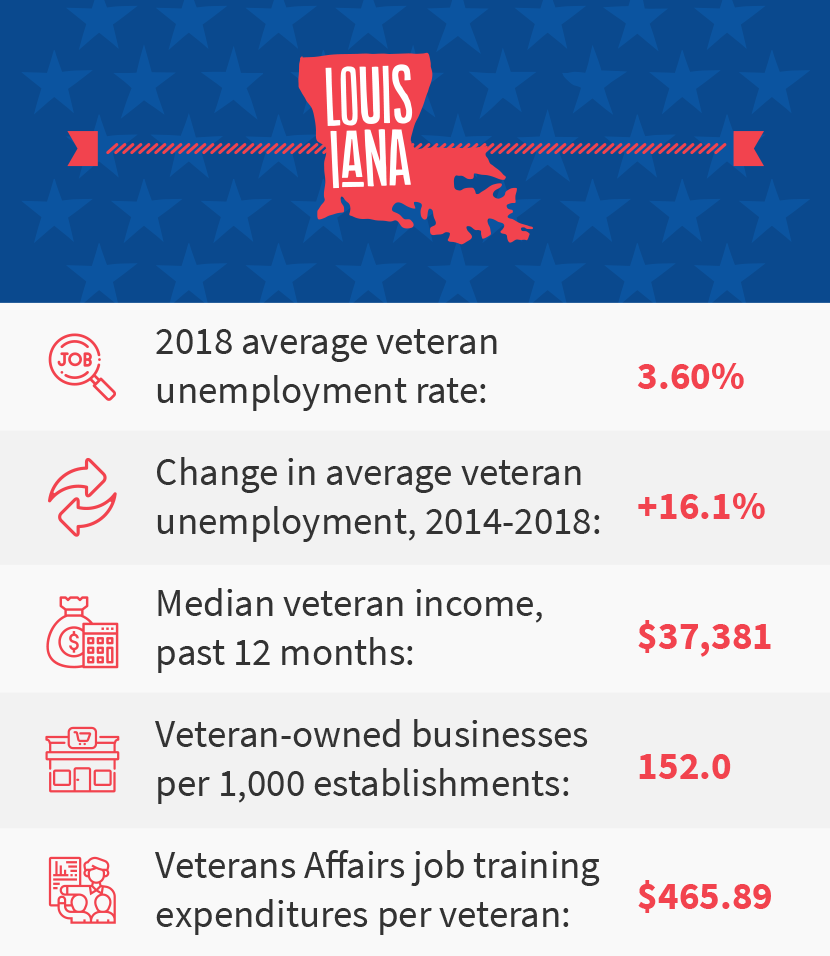
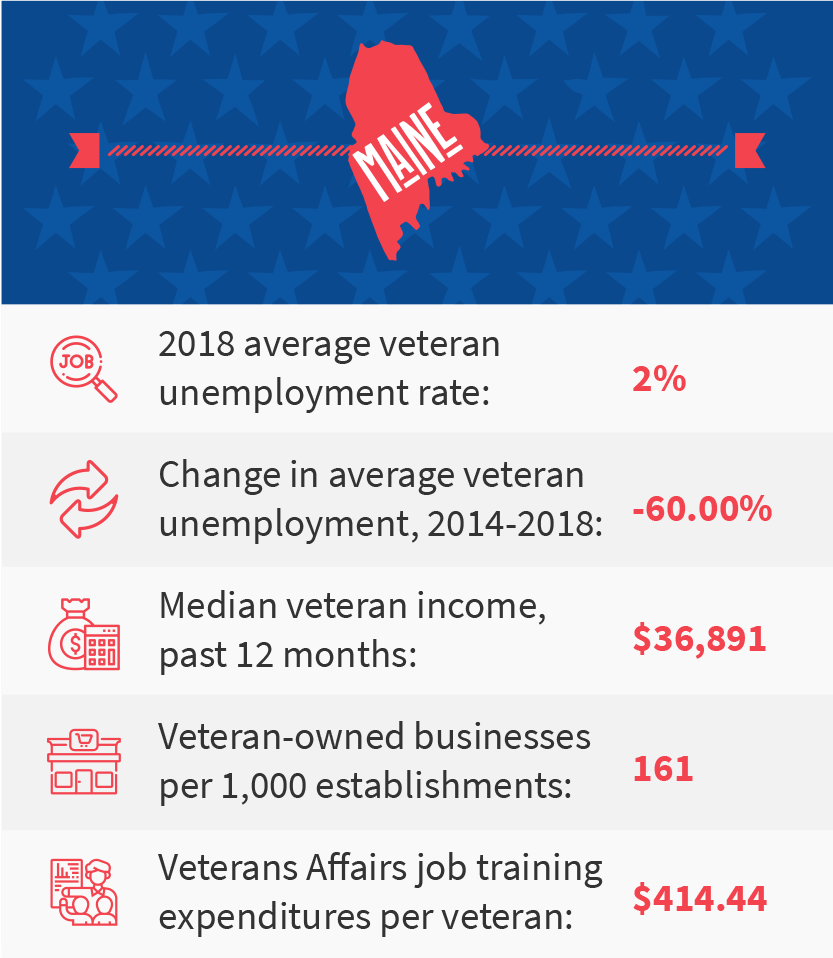
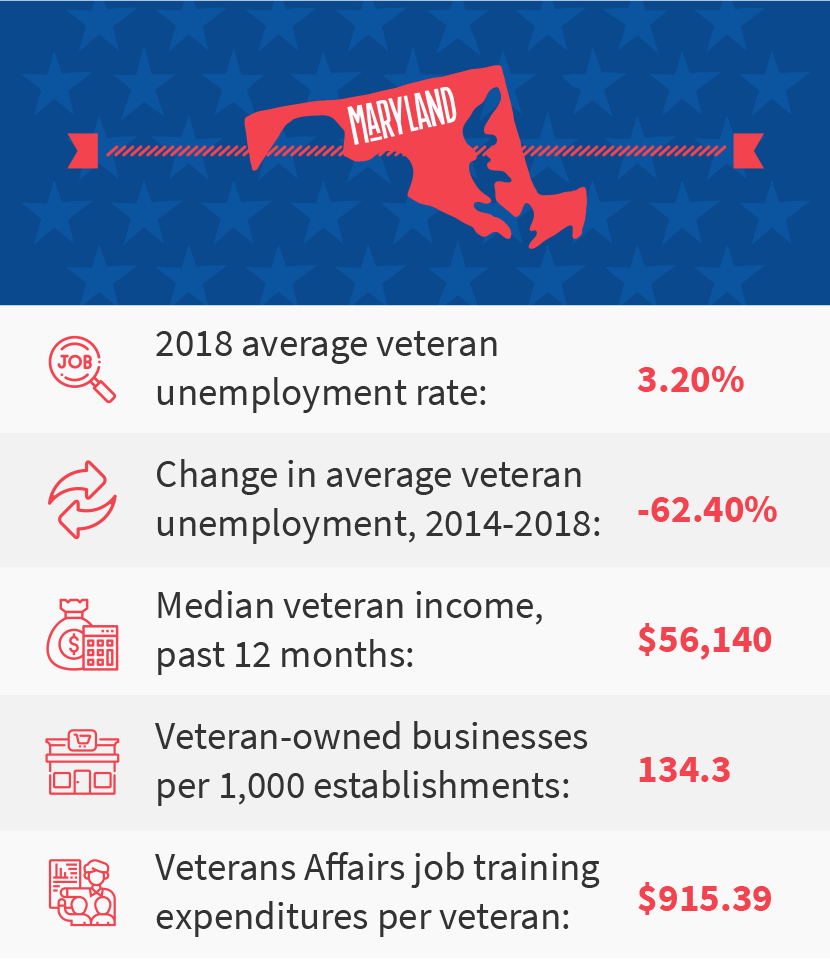
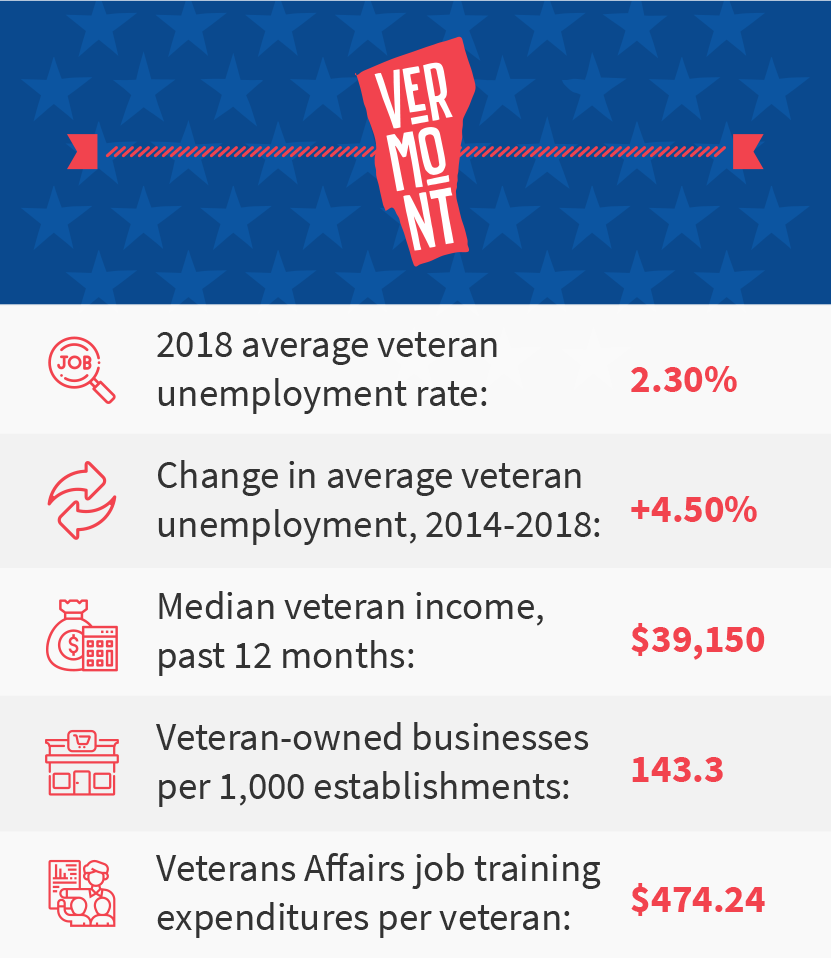
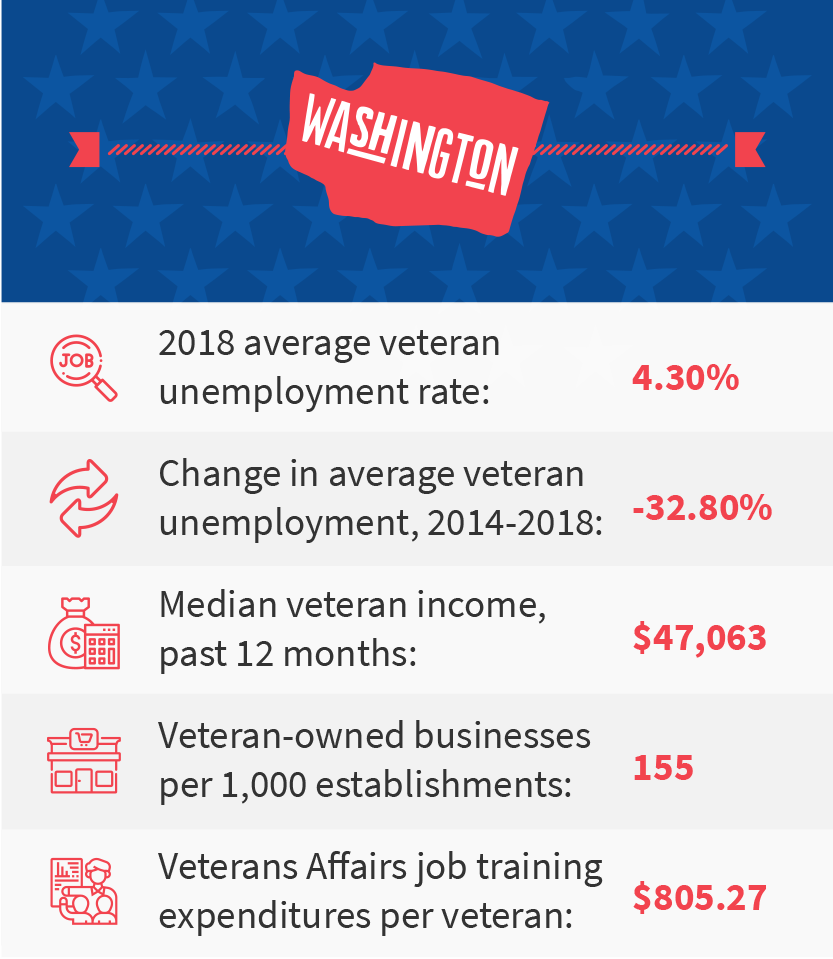
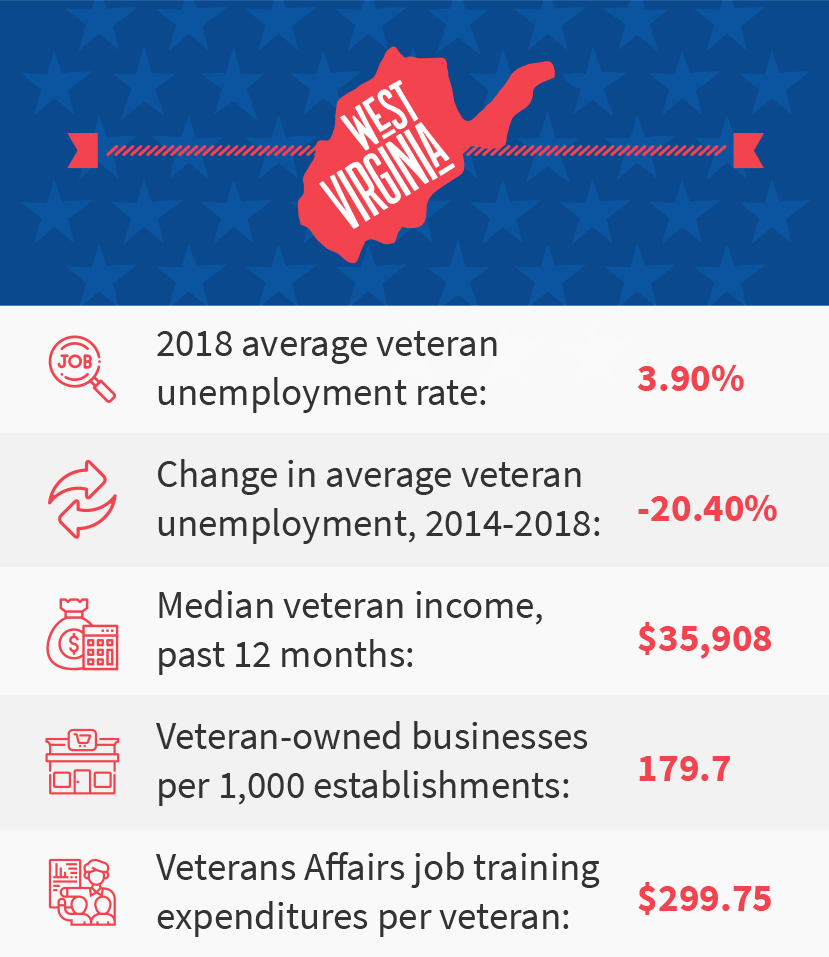
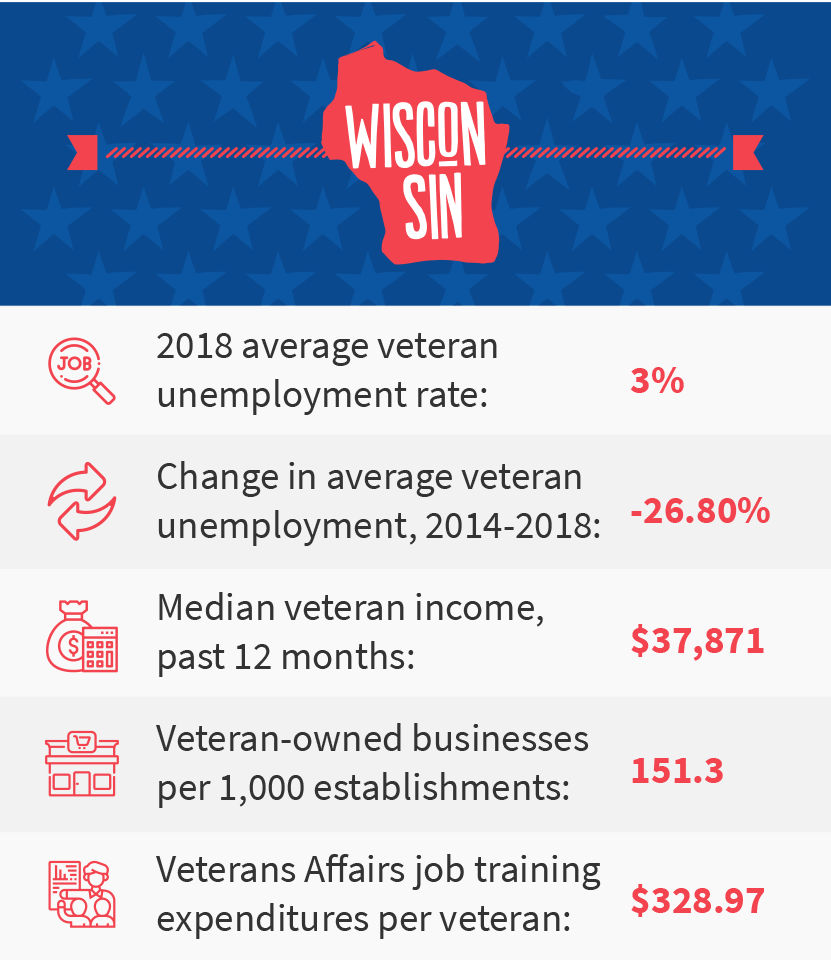
Unemployment
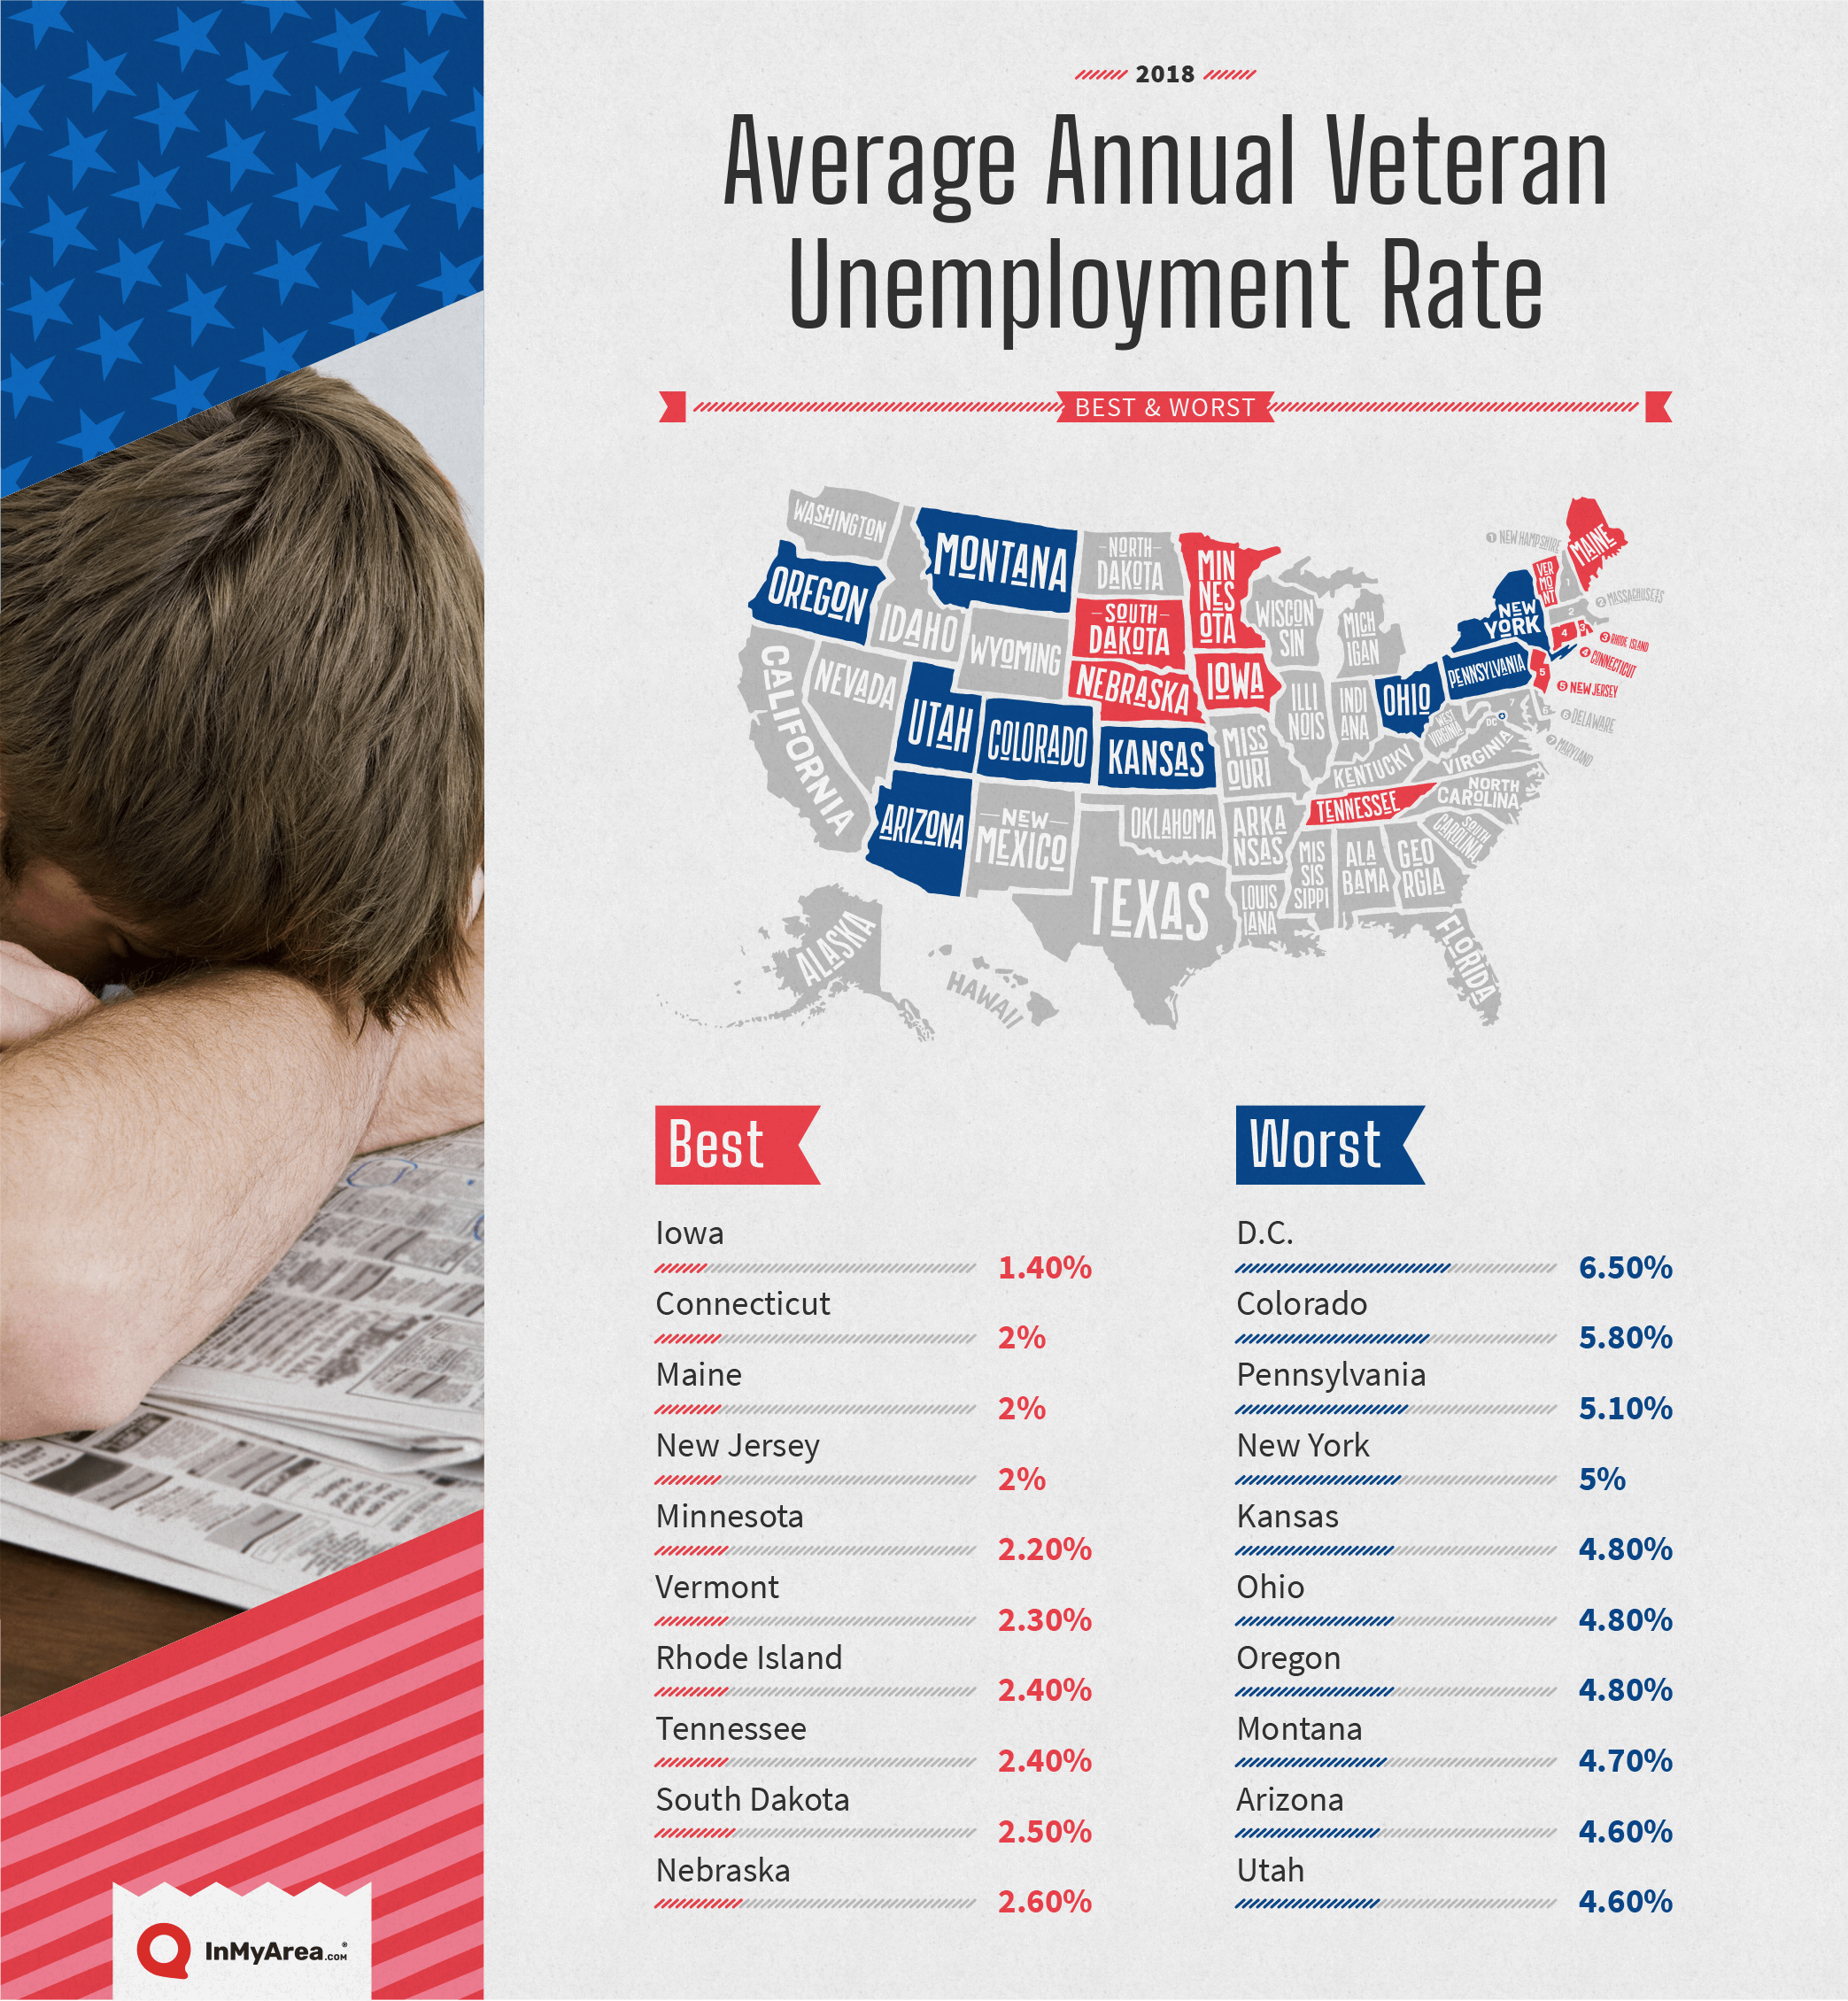
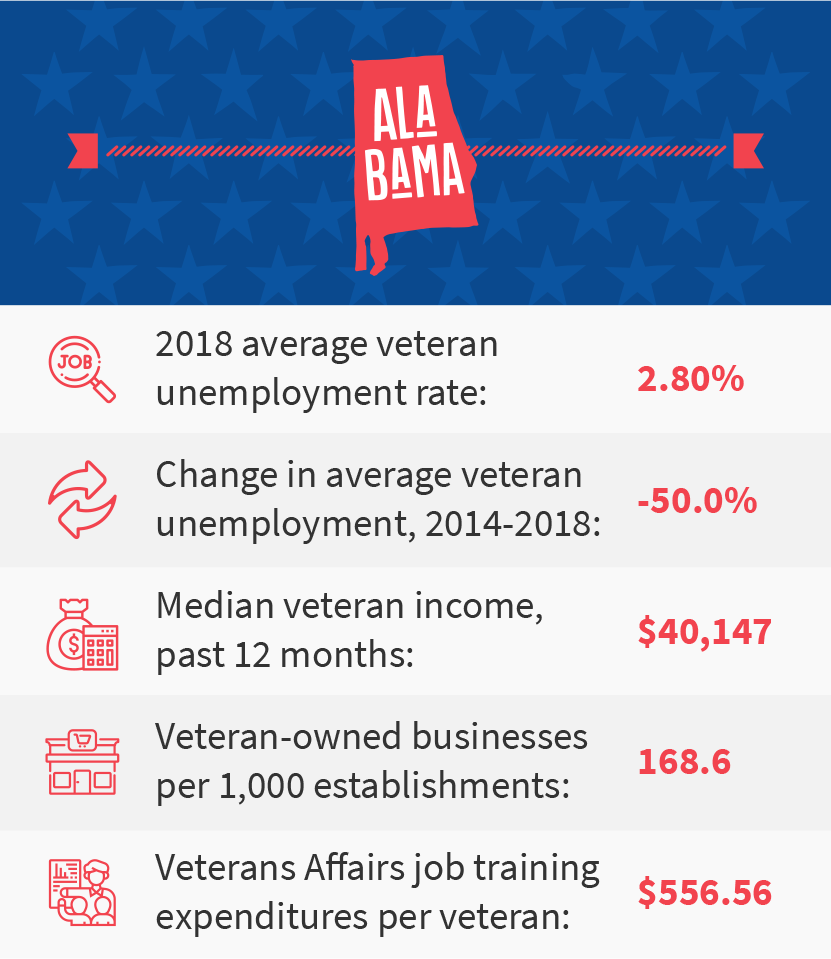
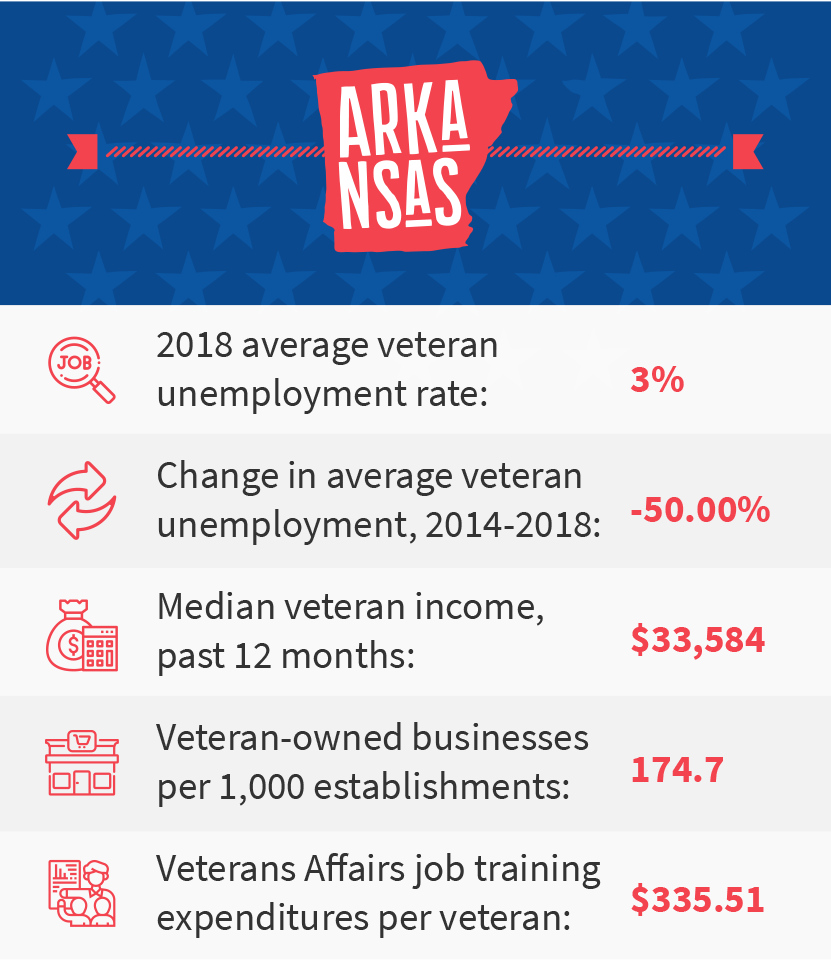
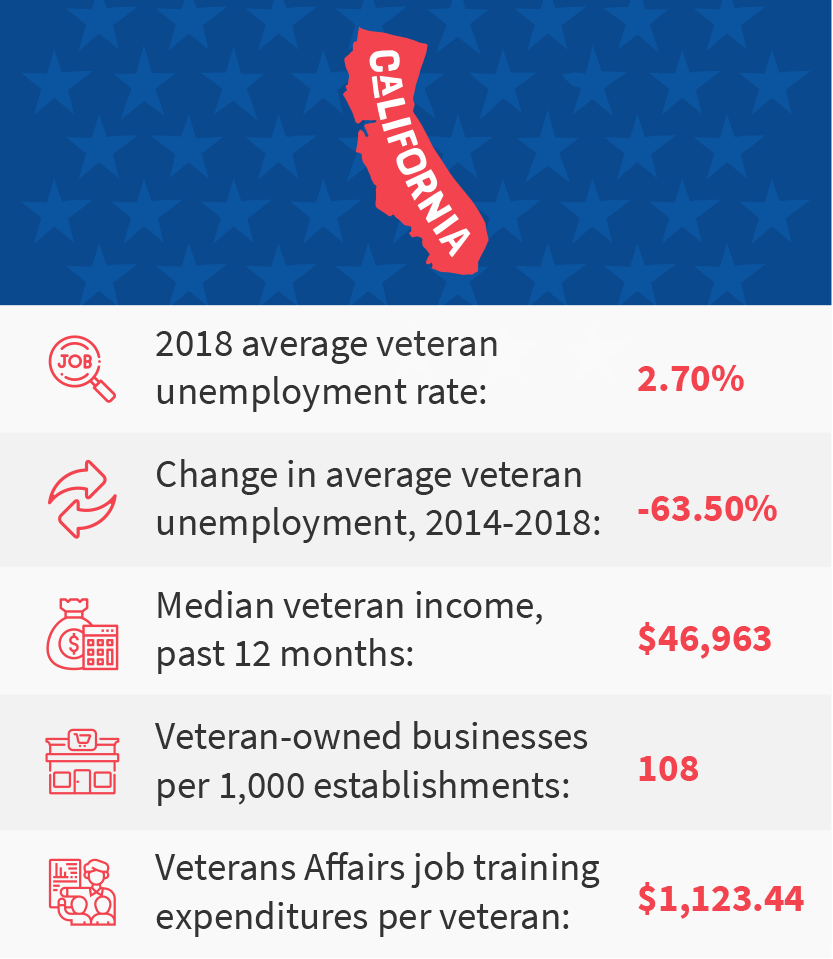
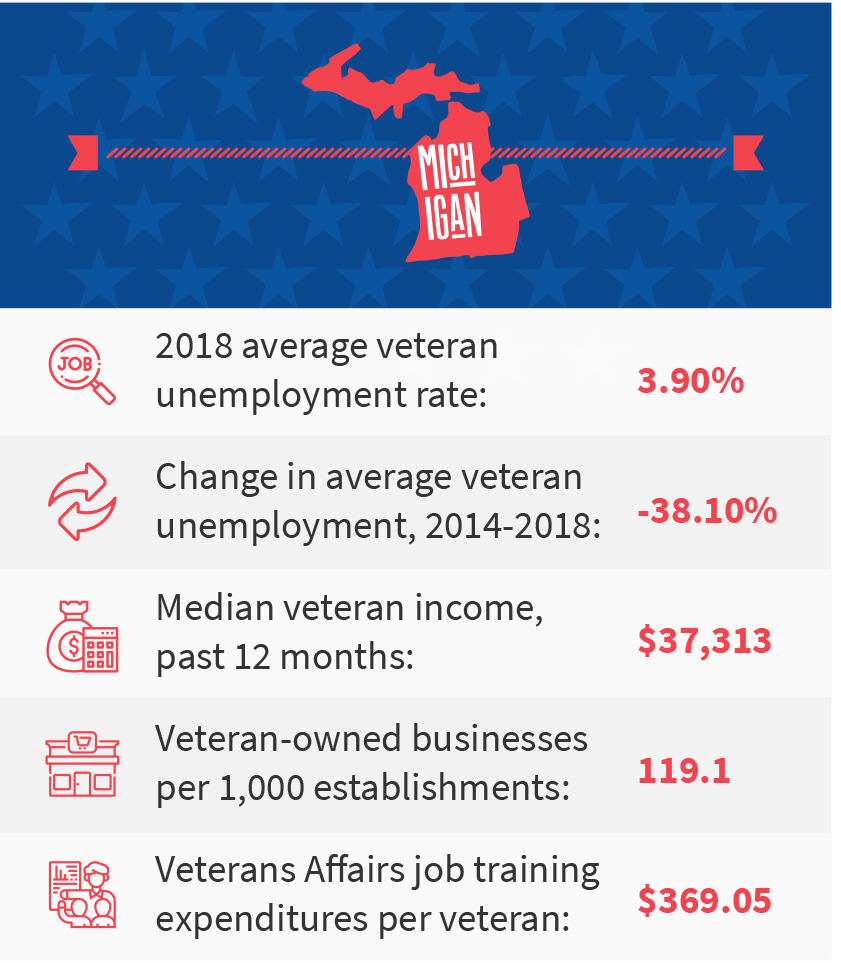
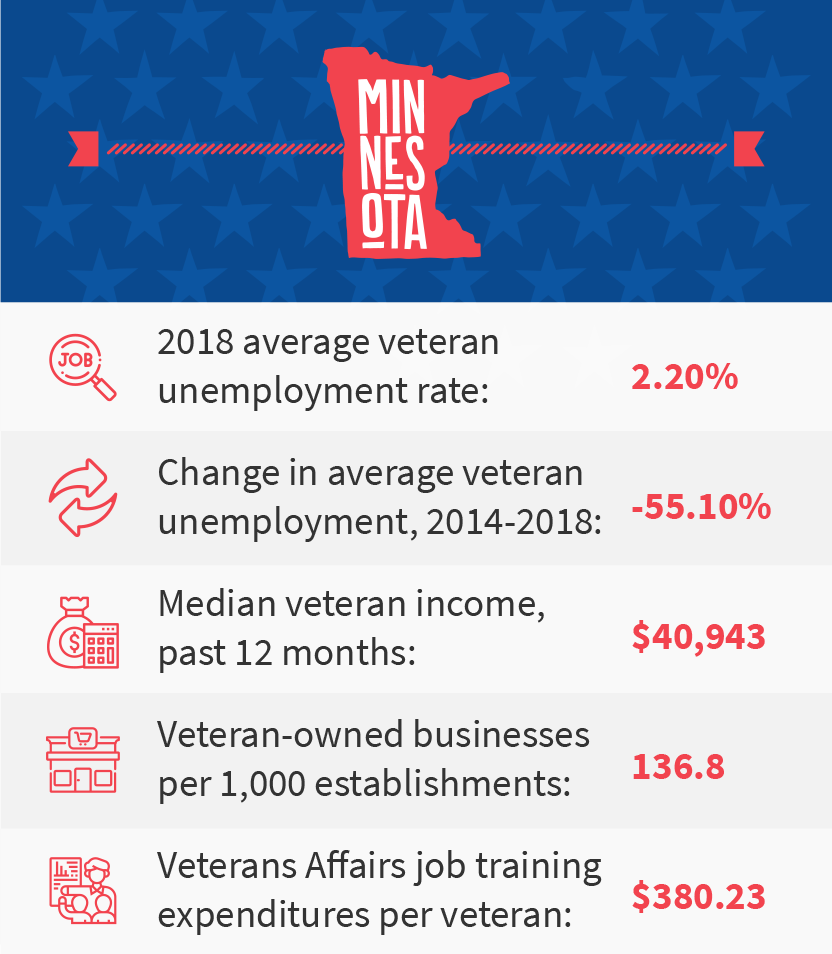
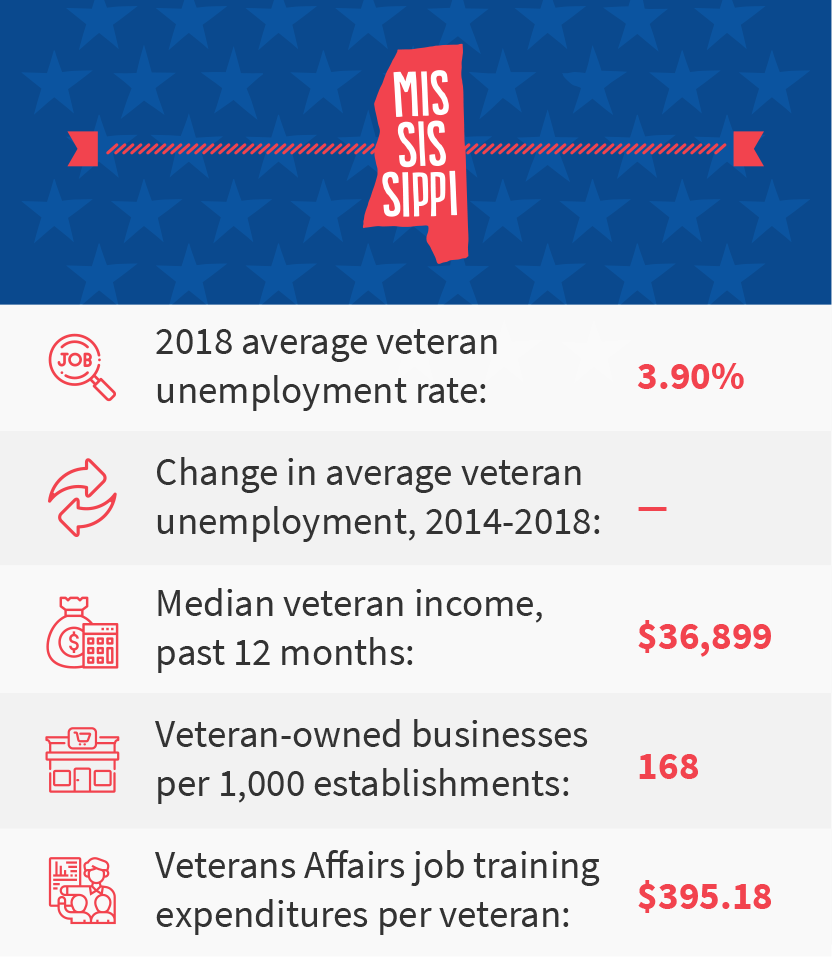
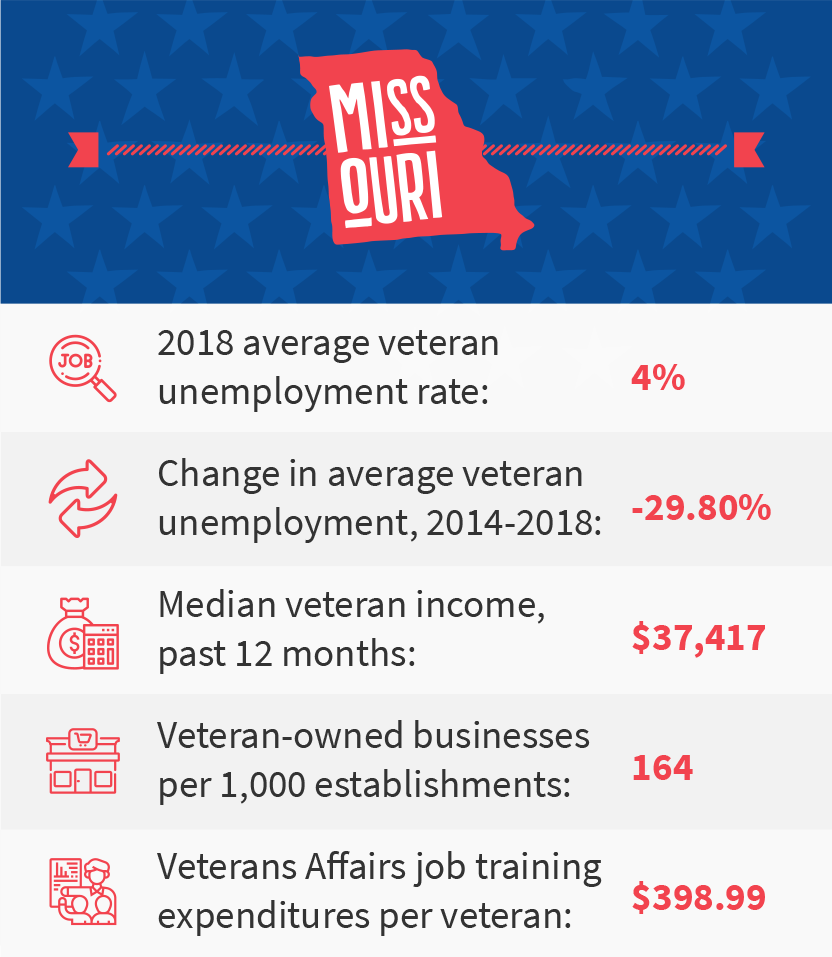
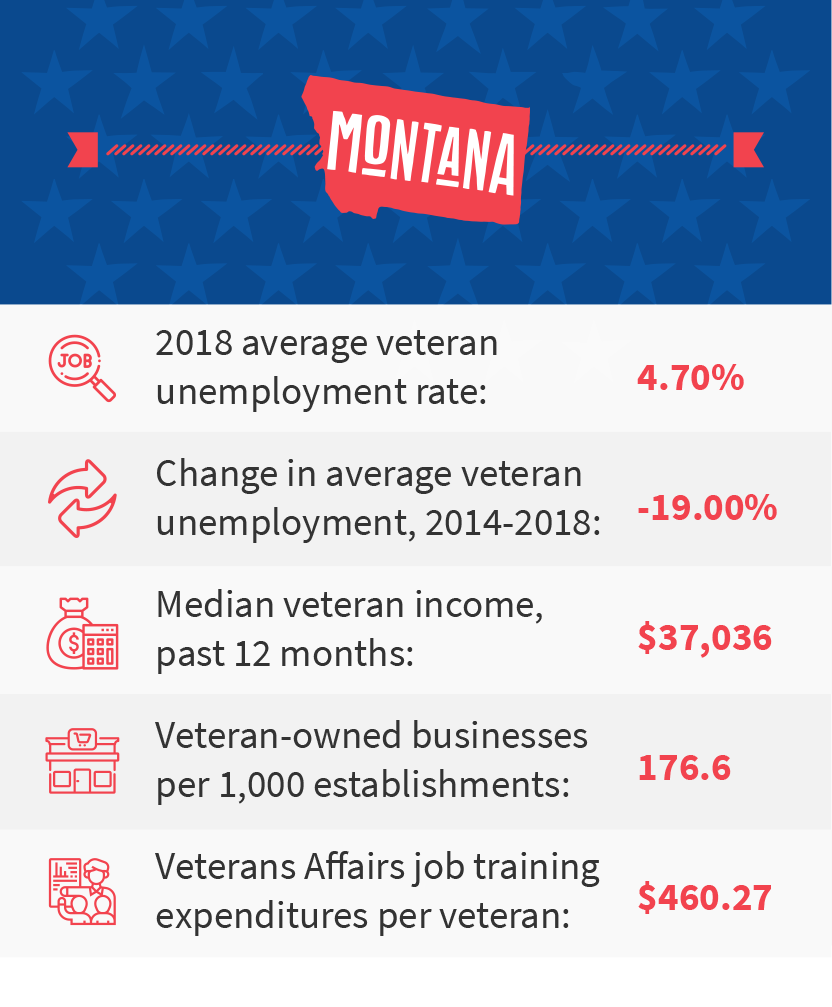
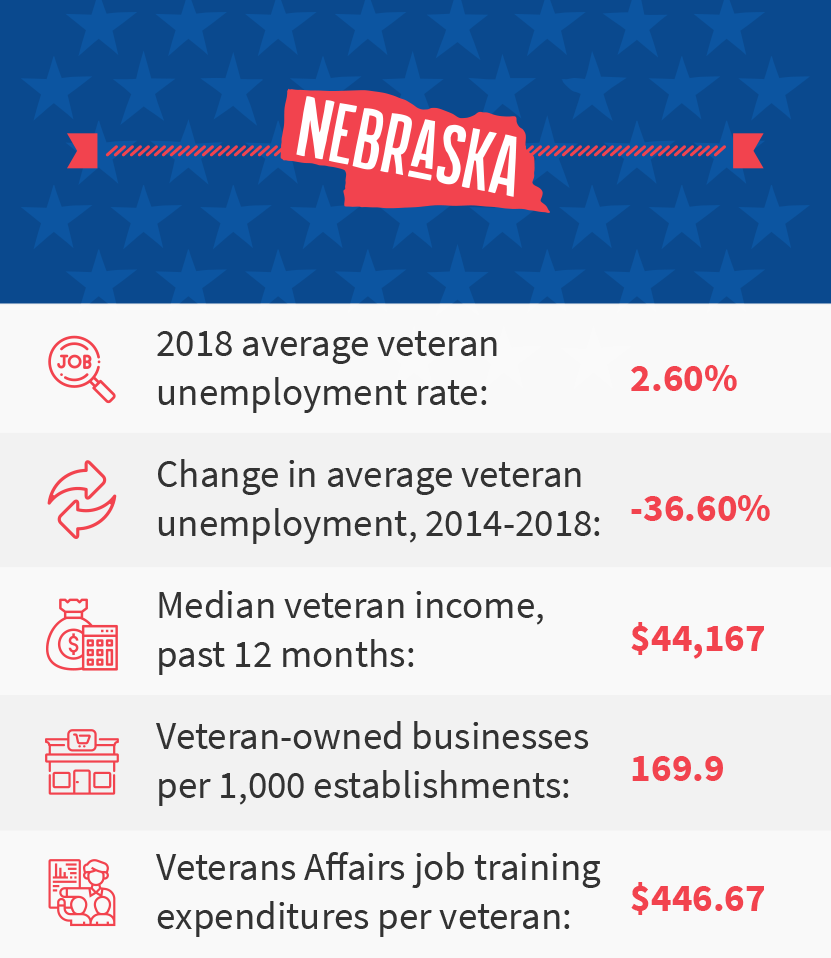
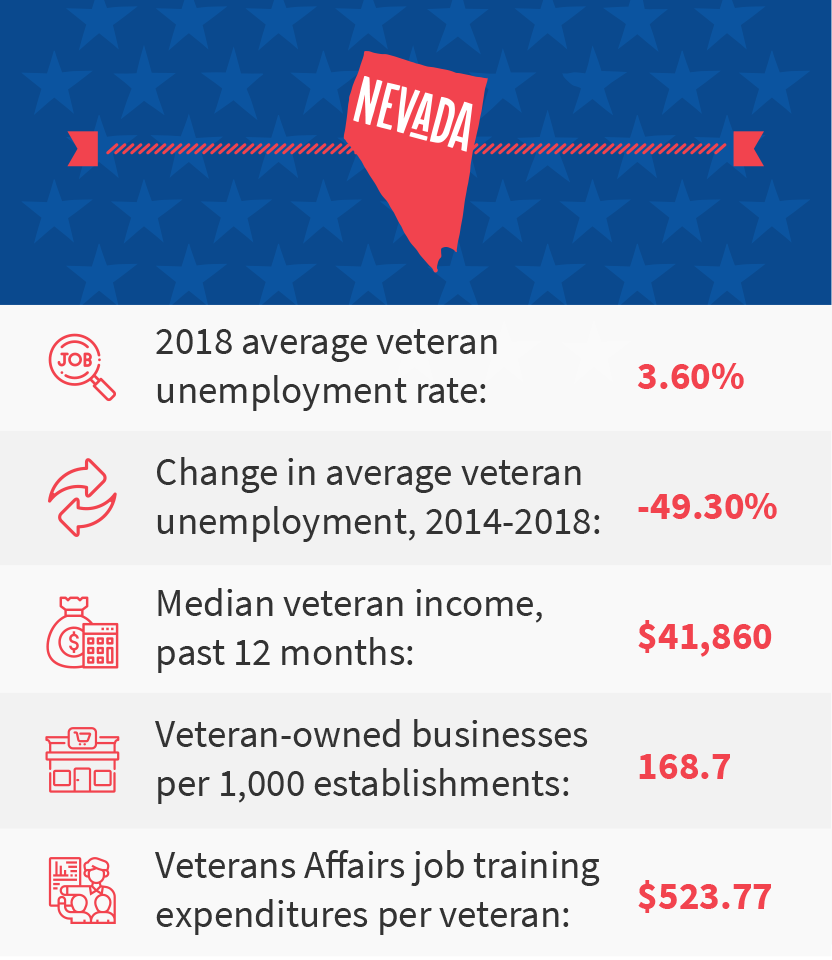
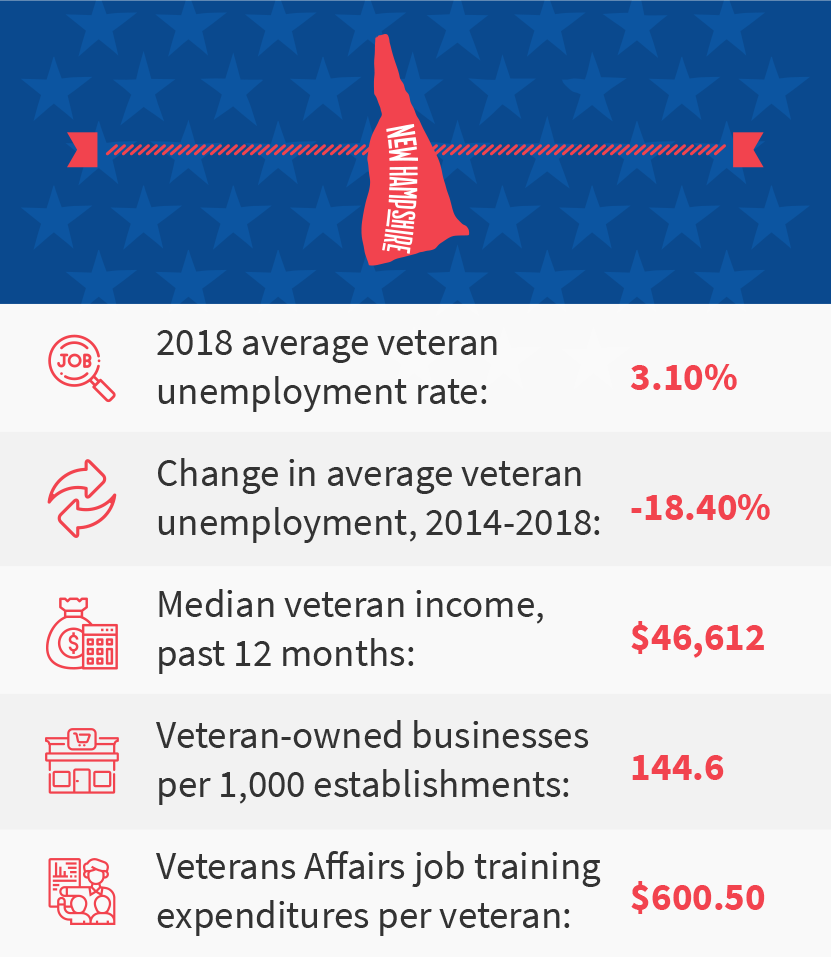
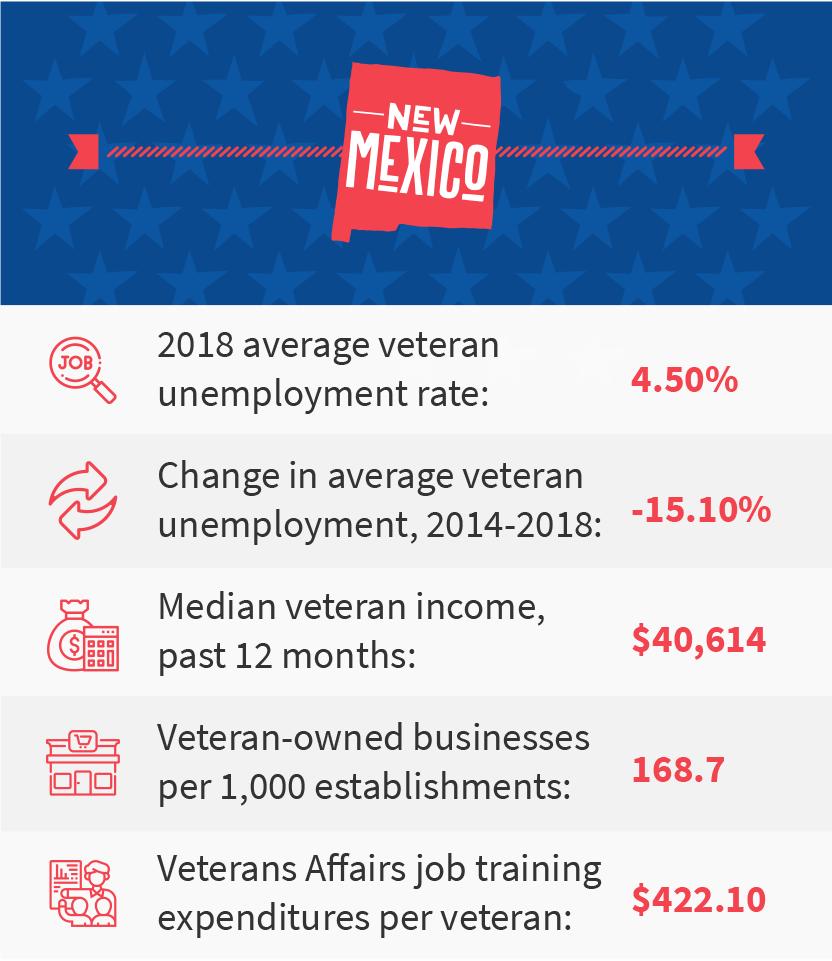
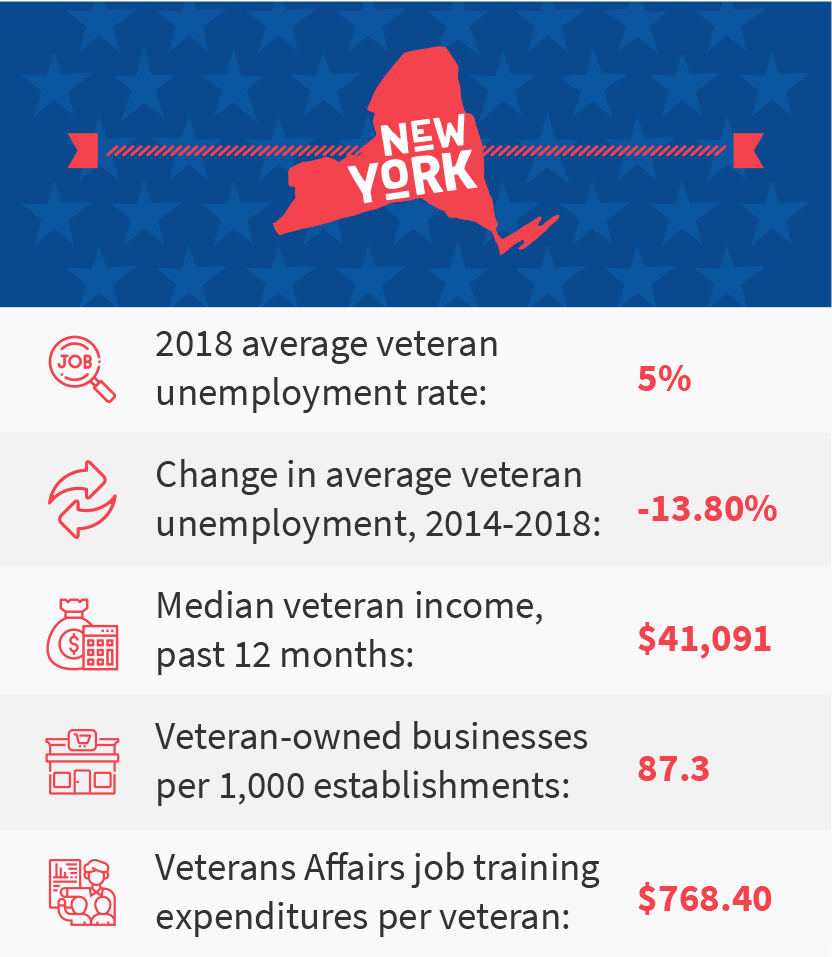
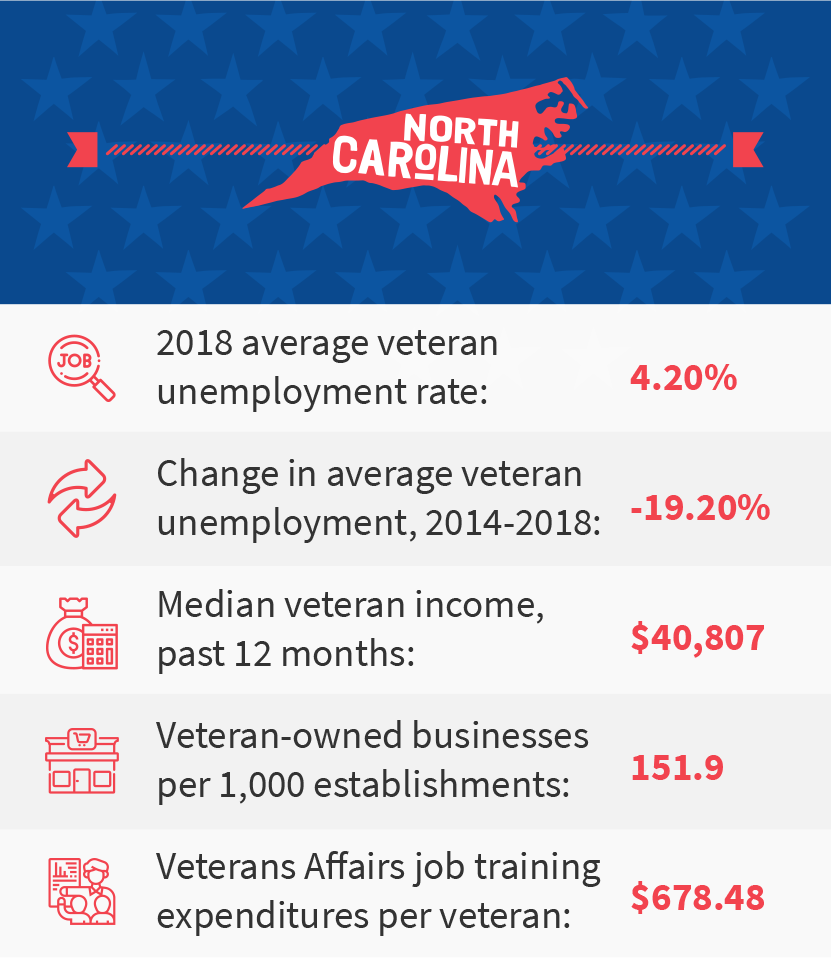
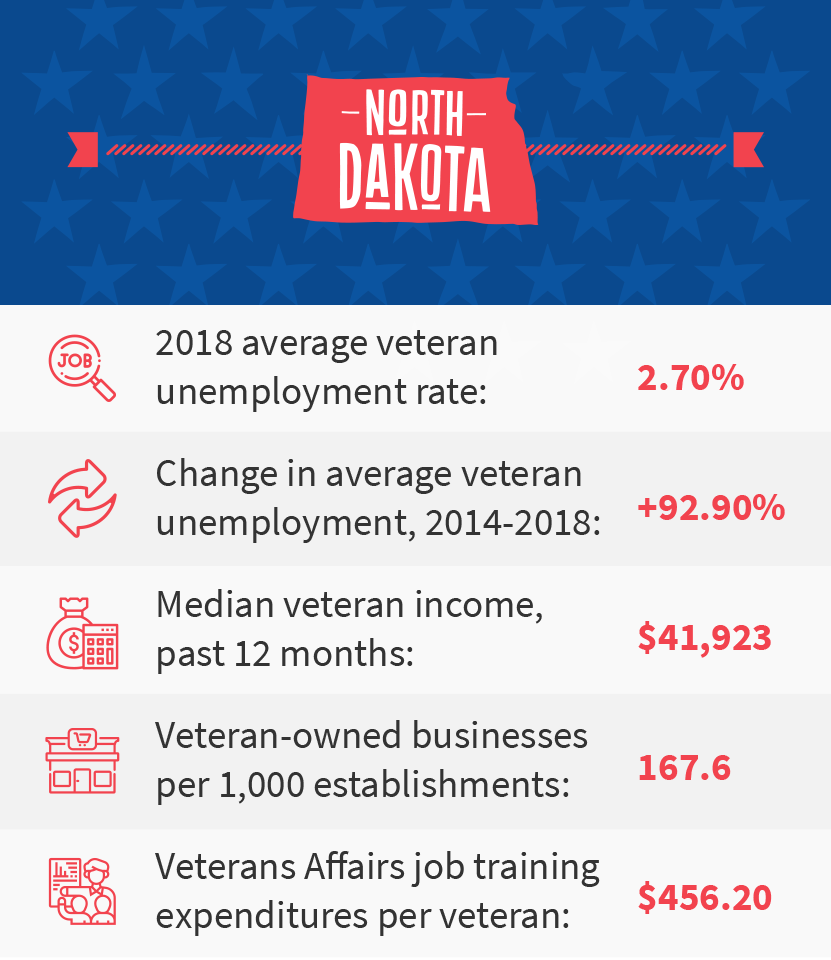
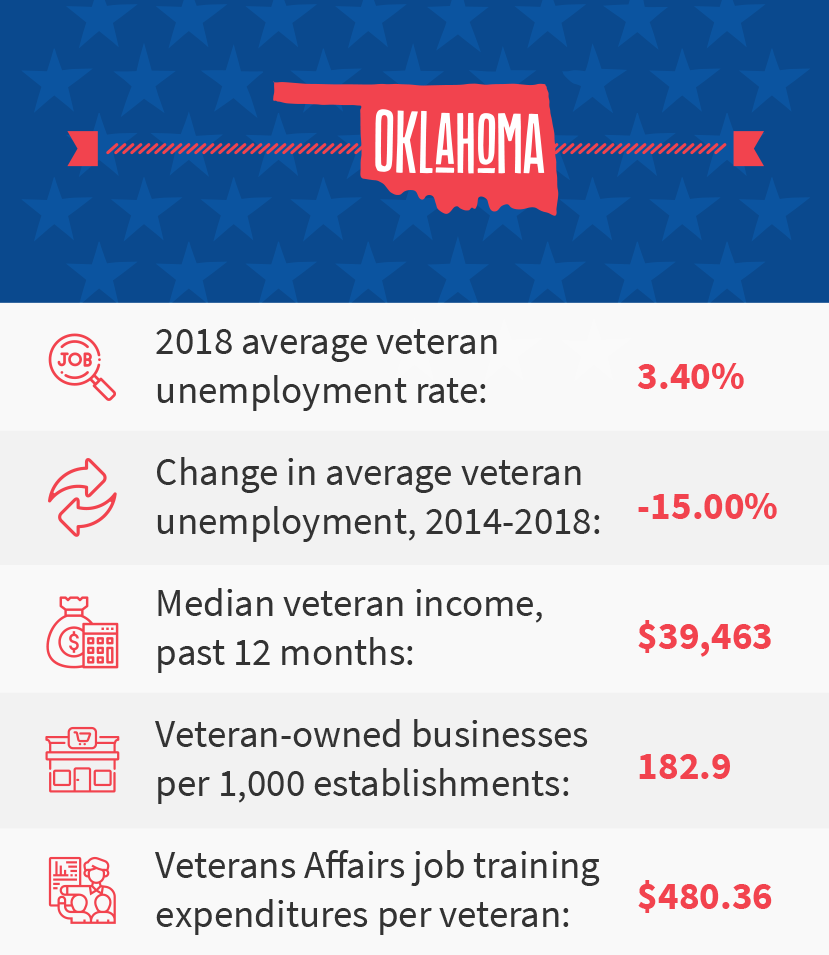
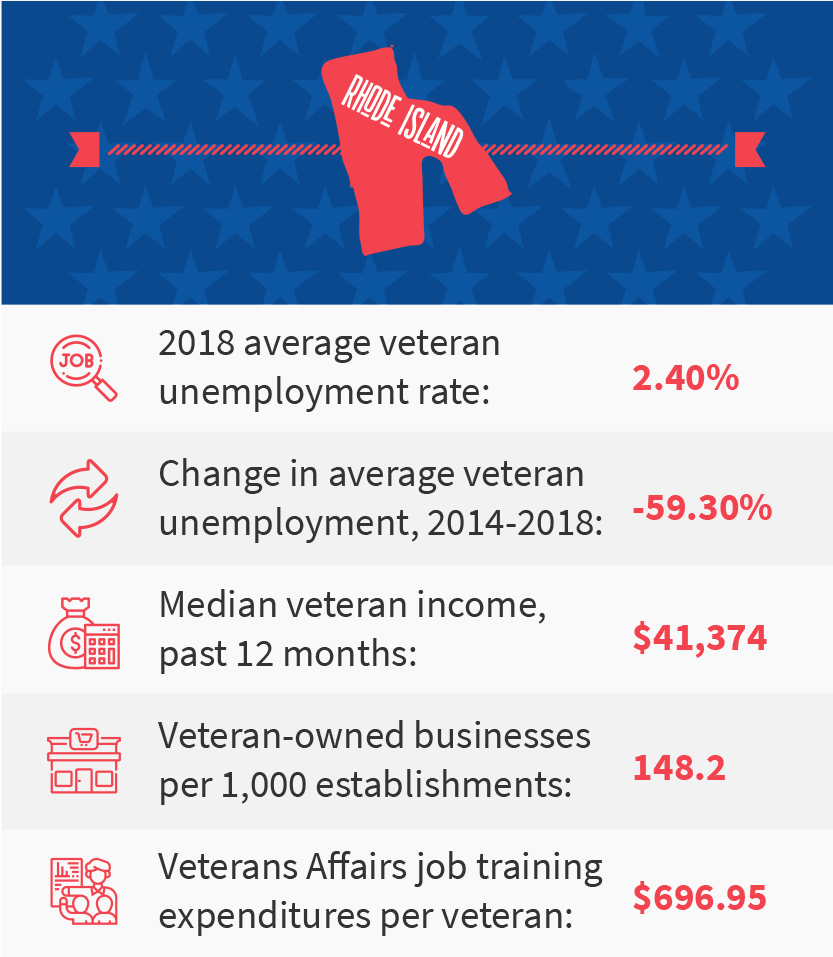
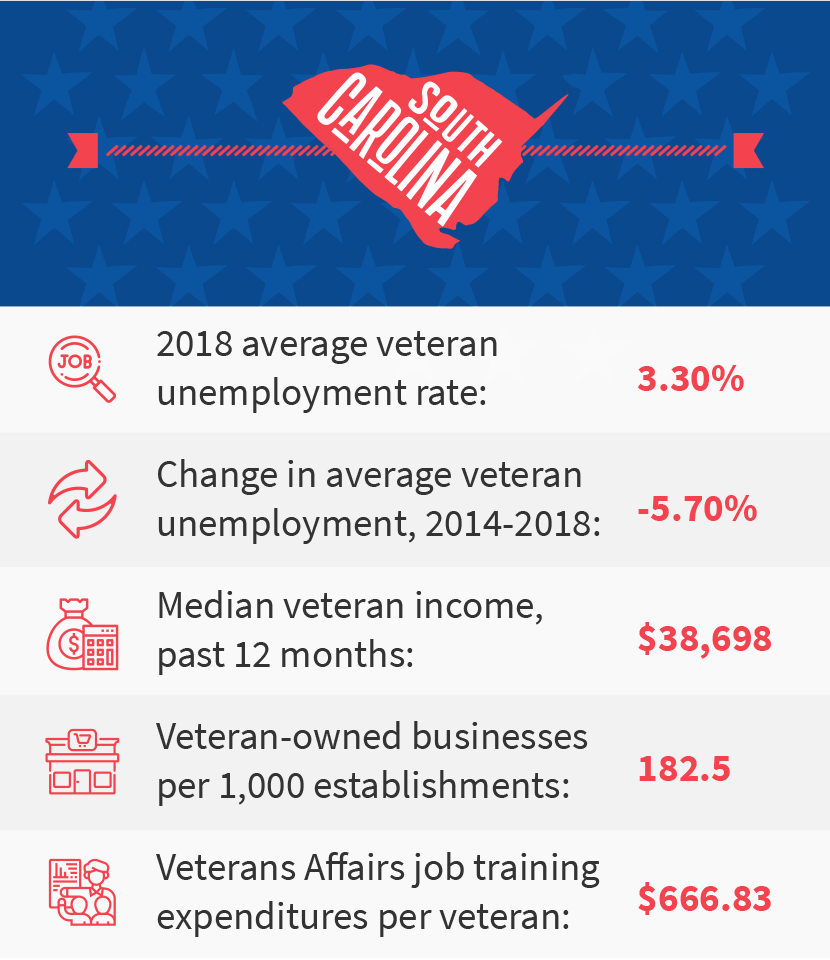
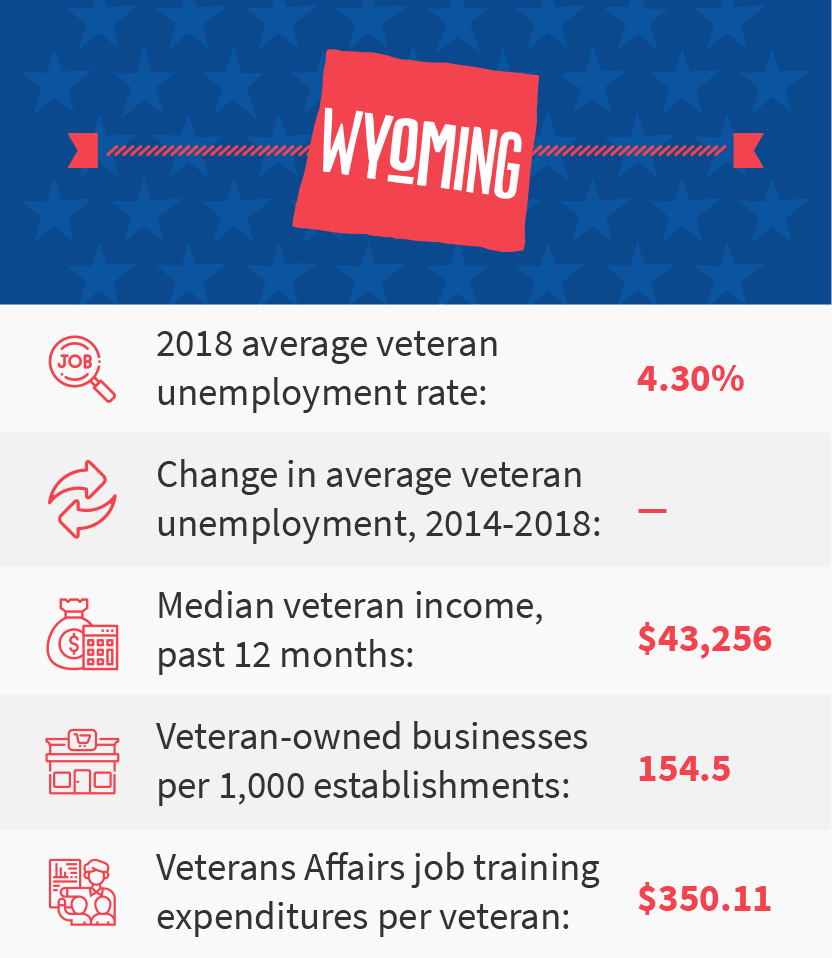
We used two measures related to unemployment in our ranking: average annual unemployment and the change in this rate over time. The most recent year for which the U.S. Bureau of Labor Statistics has published this data is 2018, though the 2019 figure is expected during the first half of 2020.
To calculate the change in veteran unemployment over time, we compared the 2018 annual figures to 2014, giving us a look at how these numbers have shifted over the past half-decade. We could not go further back than that because state-level data was unavailable.
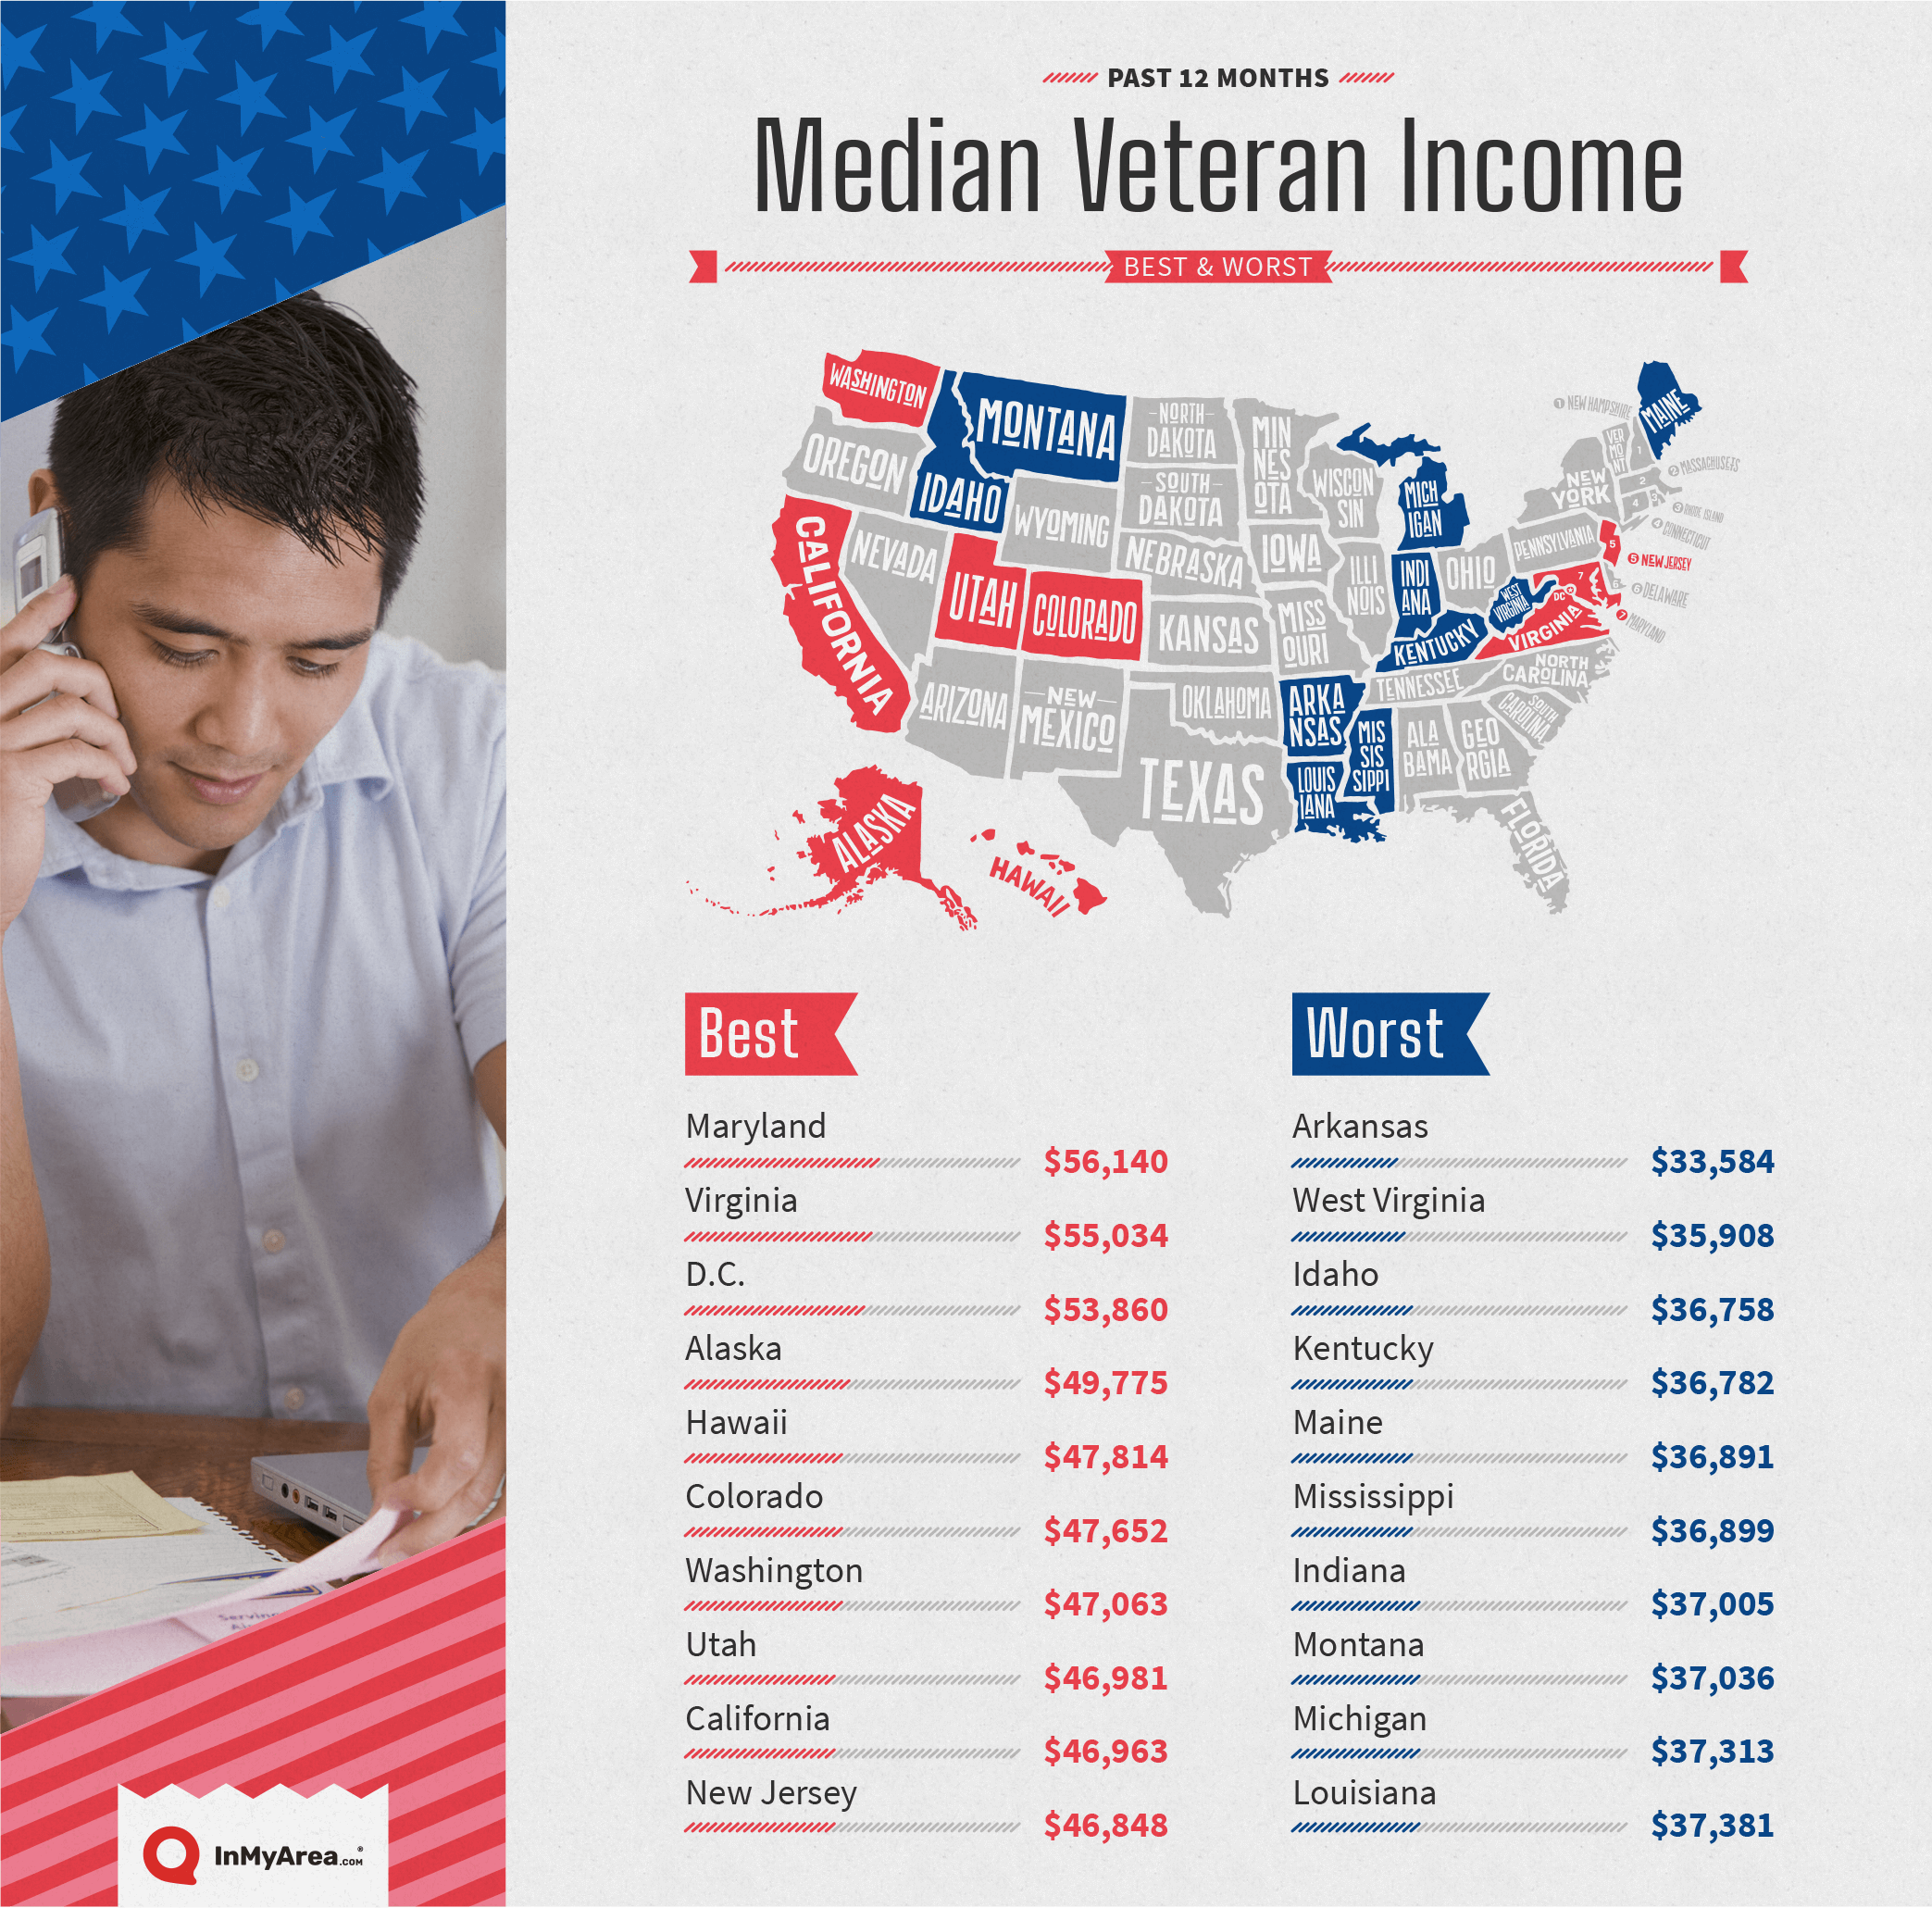
Income
According to the U.S. Census Bureau, veterans with income over the past year have a higher median income level than nonveterans — $41,555 compared to $30,833. However, it’s important to note that this covers only veterans who have had income in the past year, which excludes those who may be unemployed, underemployed or not looking for work.
For example, veterans have a considerably higher rate of disability than nonveterans: Just over 29% of veterans have a disability compared with about 14% of nonveterans. The effect of these differences may be that many lower-income veterans simply are not counted in this Census data.
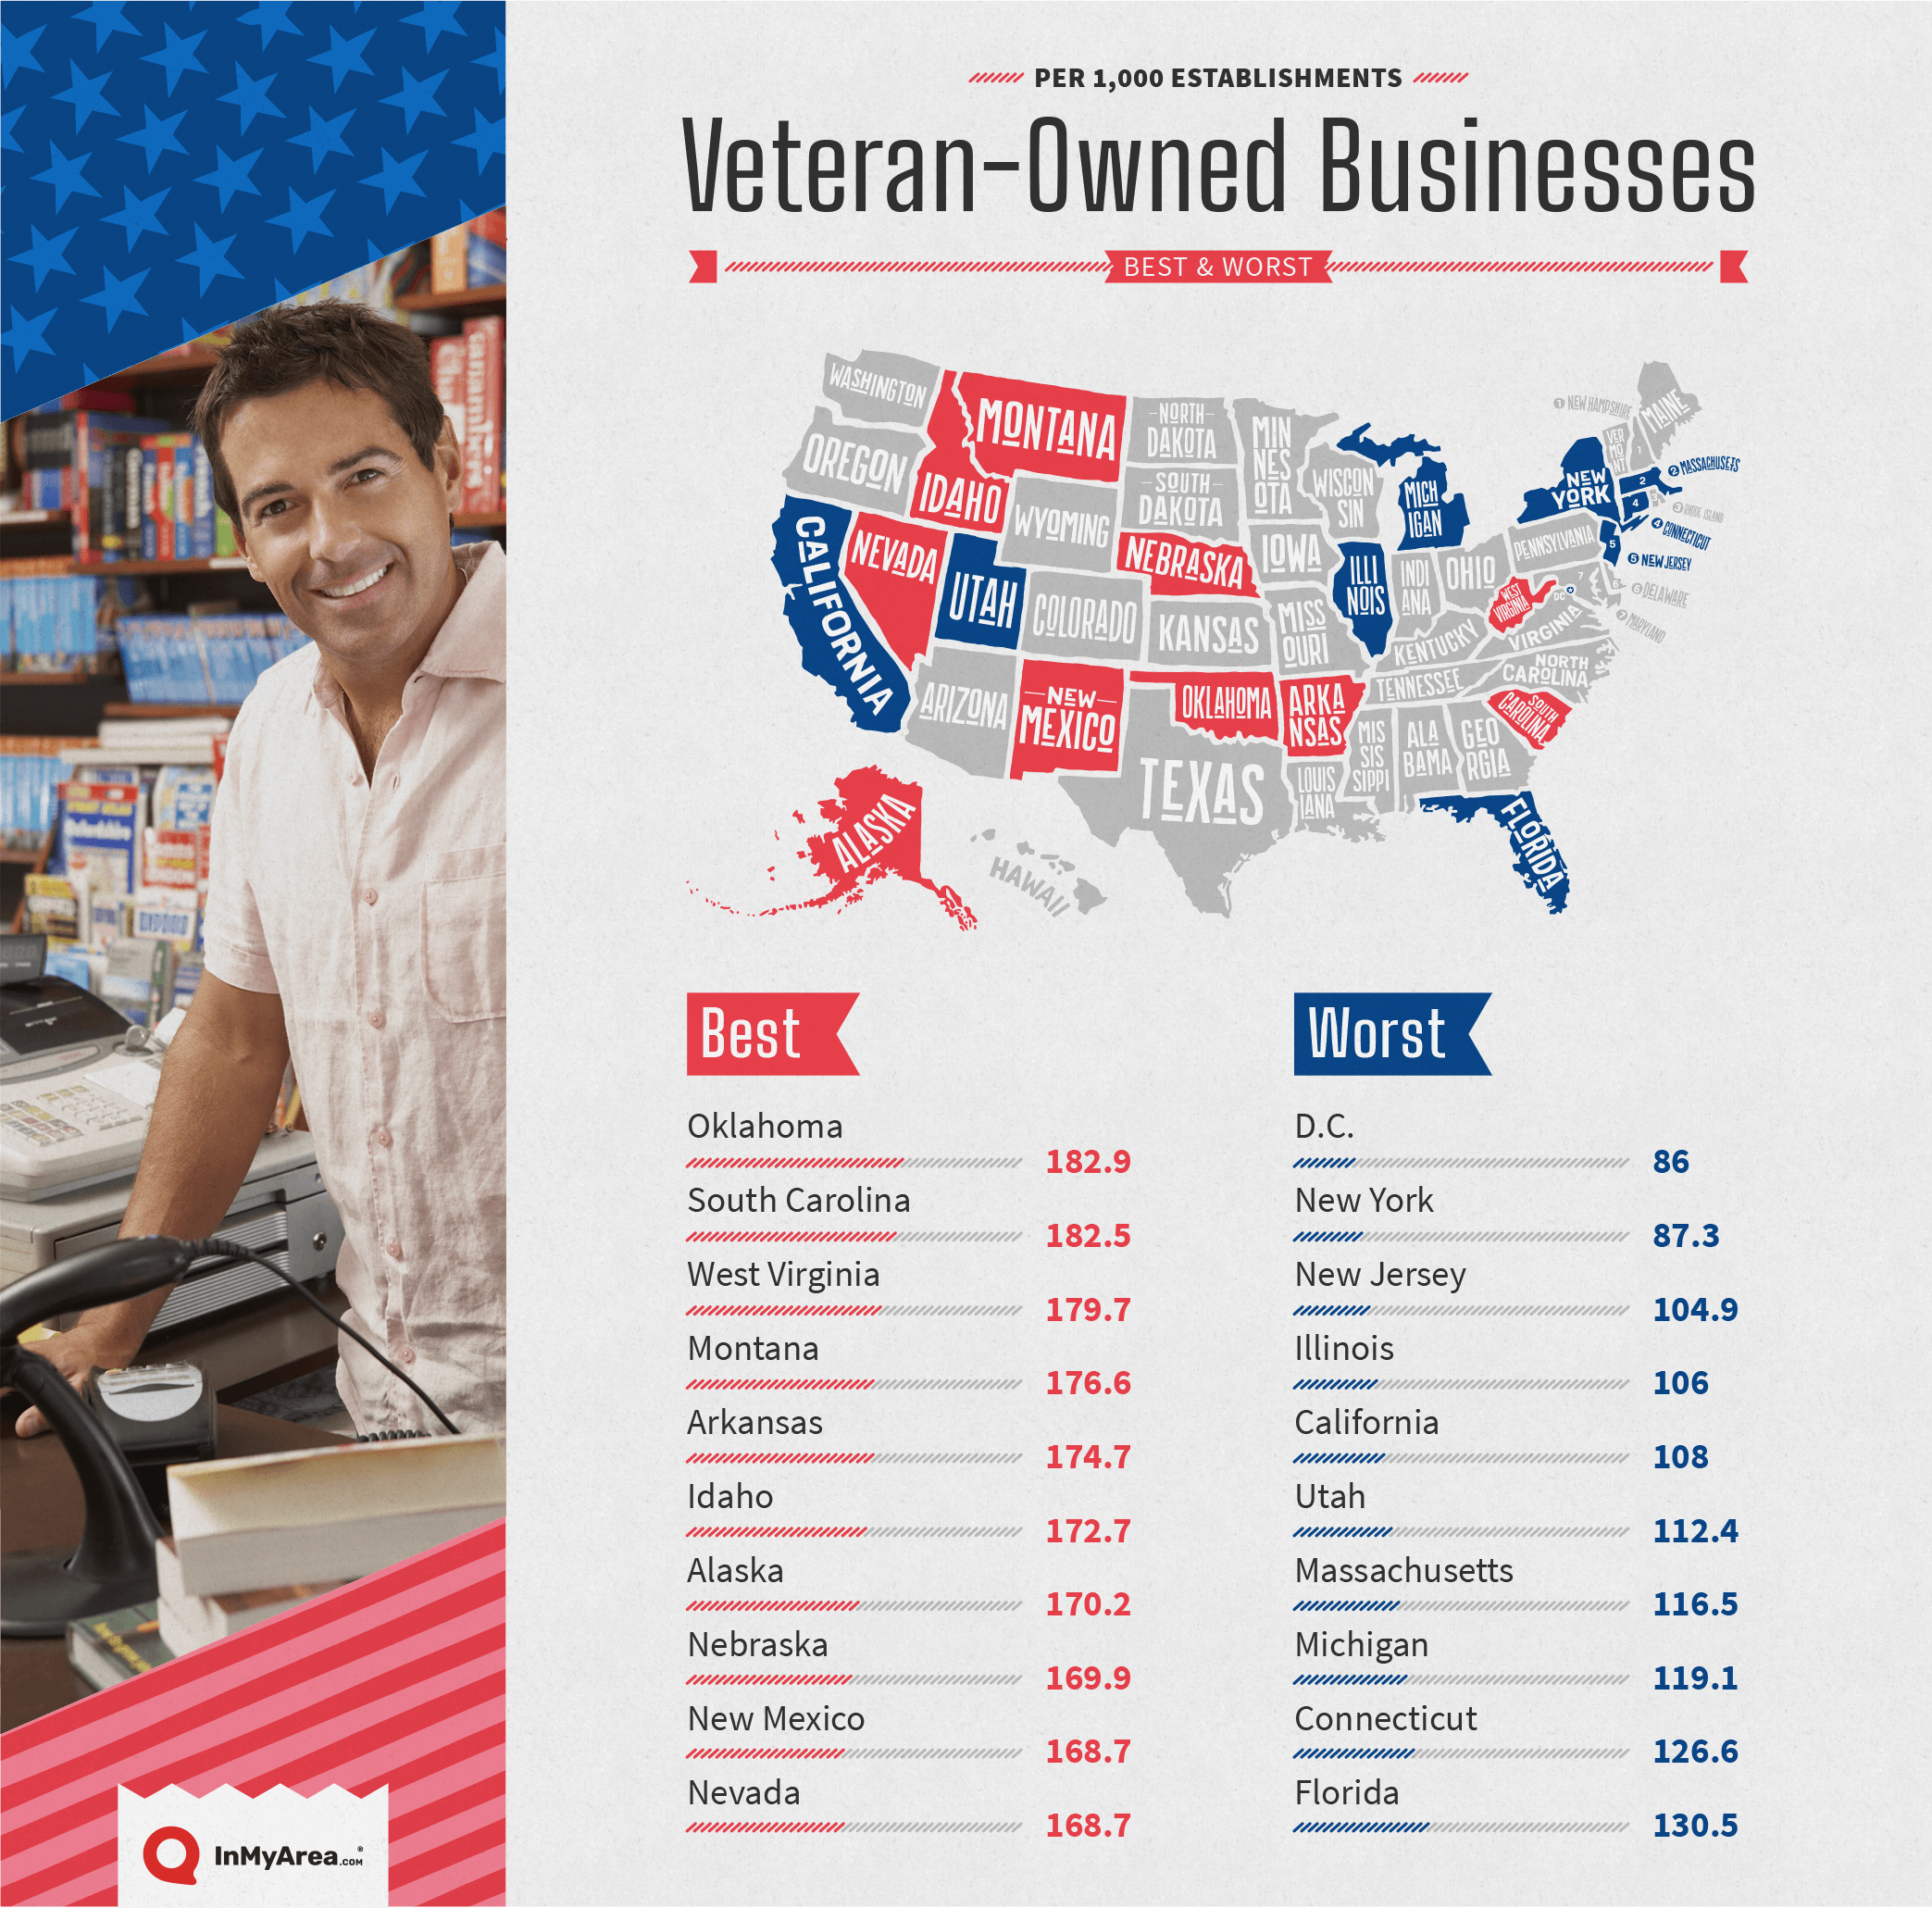
Veteran-Owned Businesses
About 2 in 3 Americans would like to open a small business, according to a UPS Store survey in 2019, and for military veterans, owning their own business can be a particularly ideal way to sidestep some of the unpleasant aspects to re-entry into the workforce. Veterans own businesses at a rate of about 135 per 1,000 establishments, according to data published by VeteranOwnedBusiness.com, an online veteran-owned business directory.
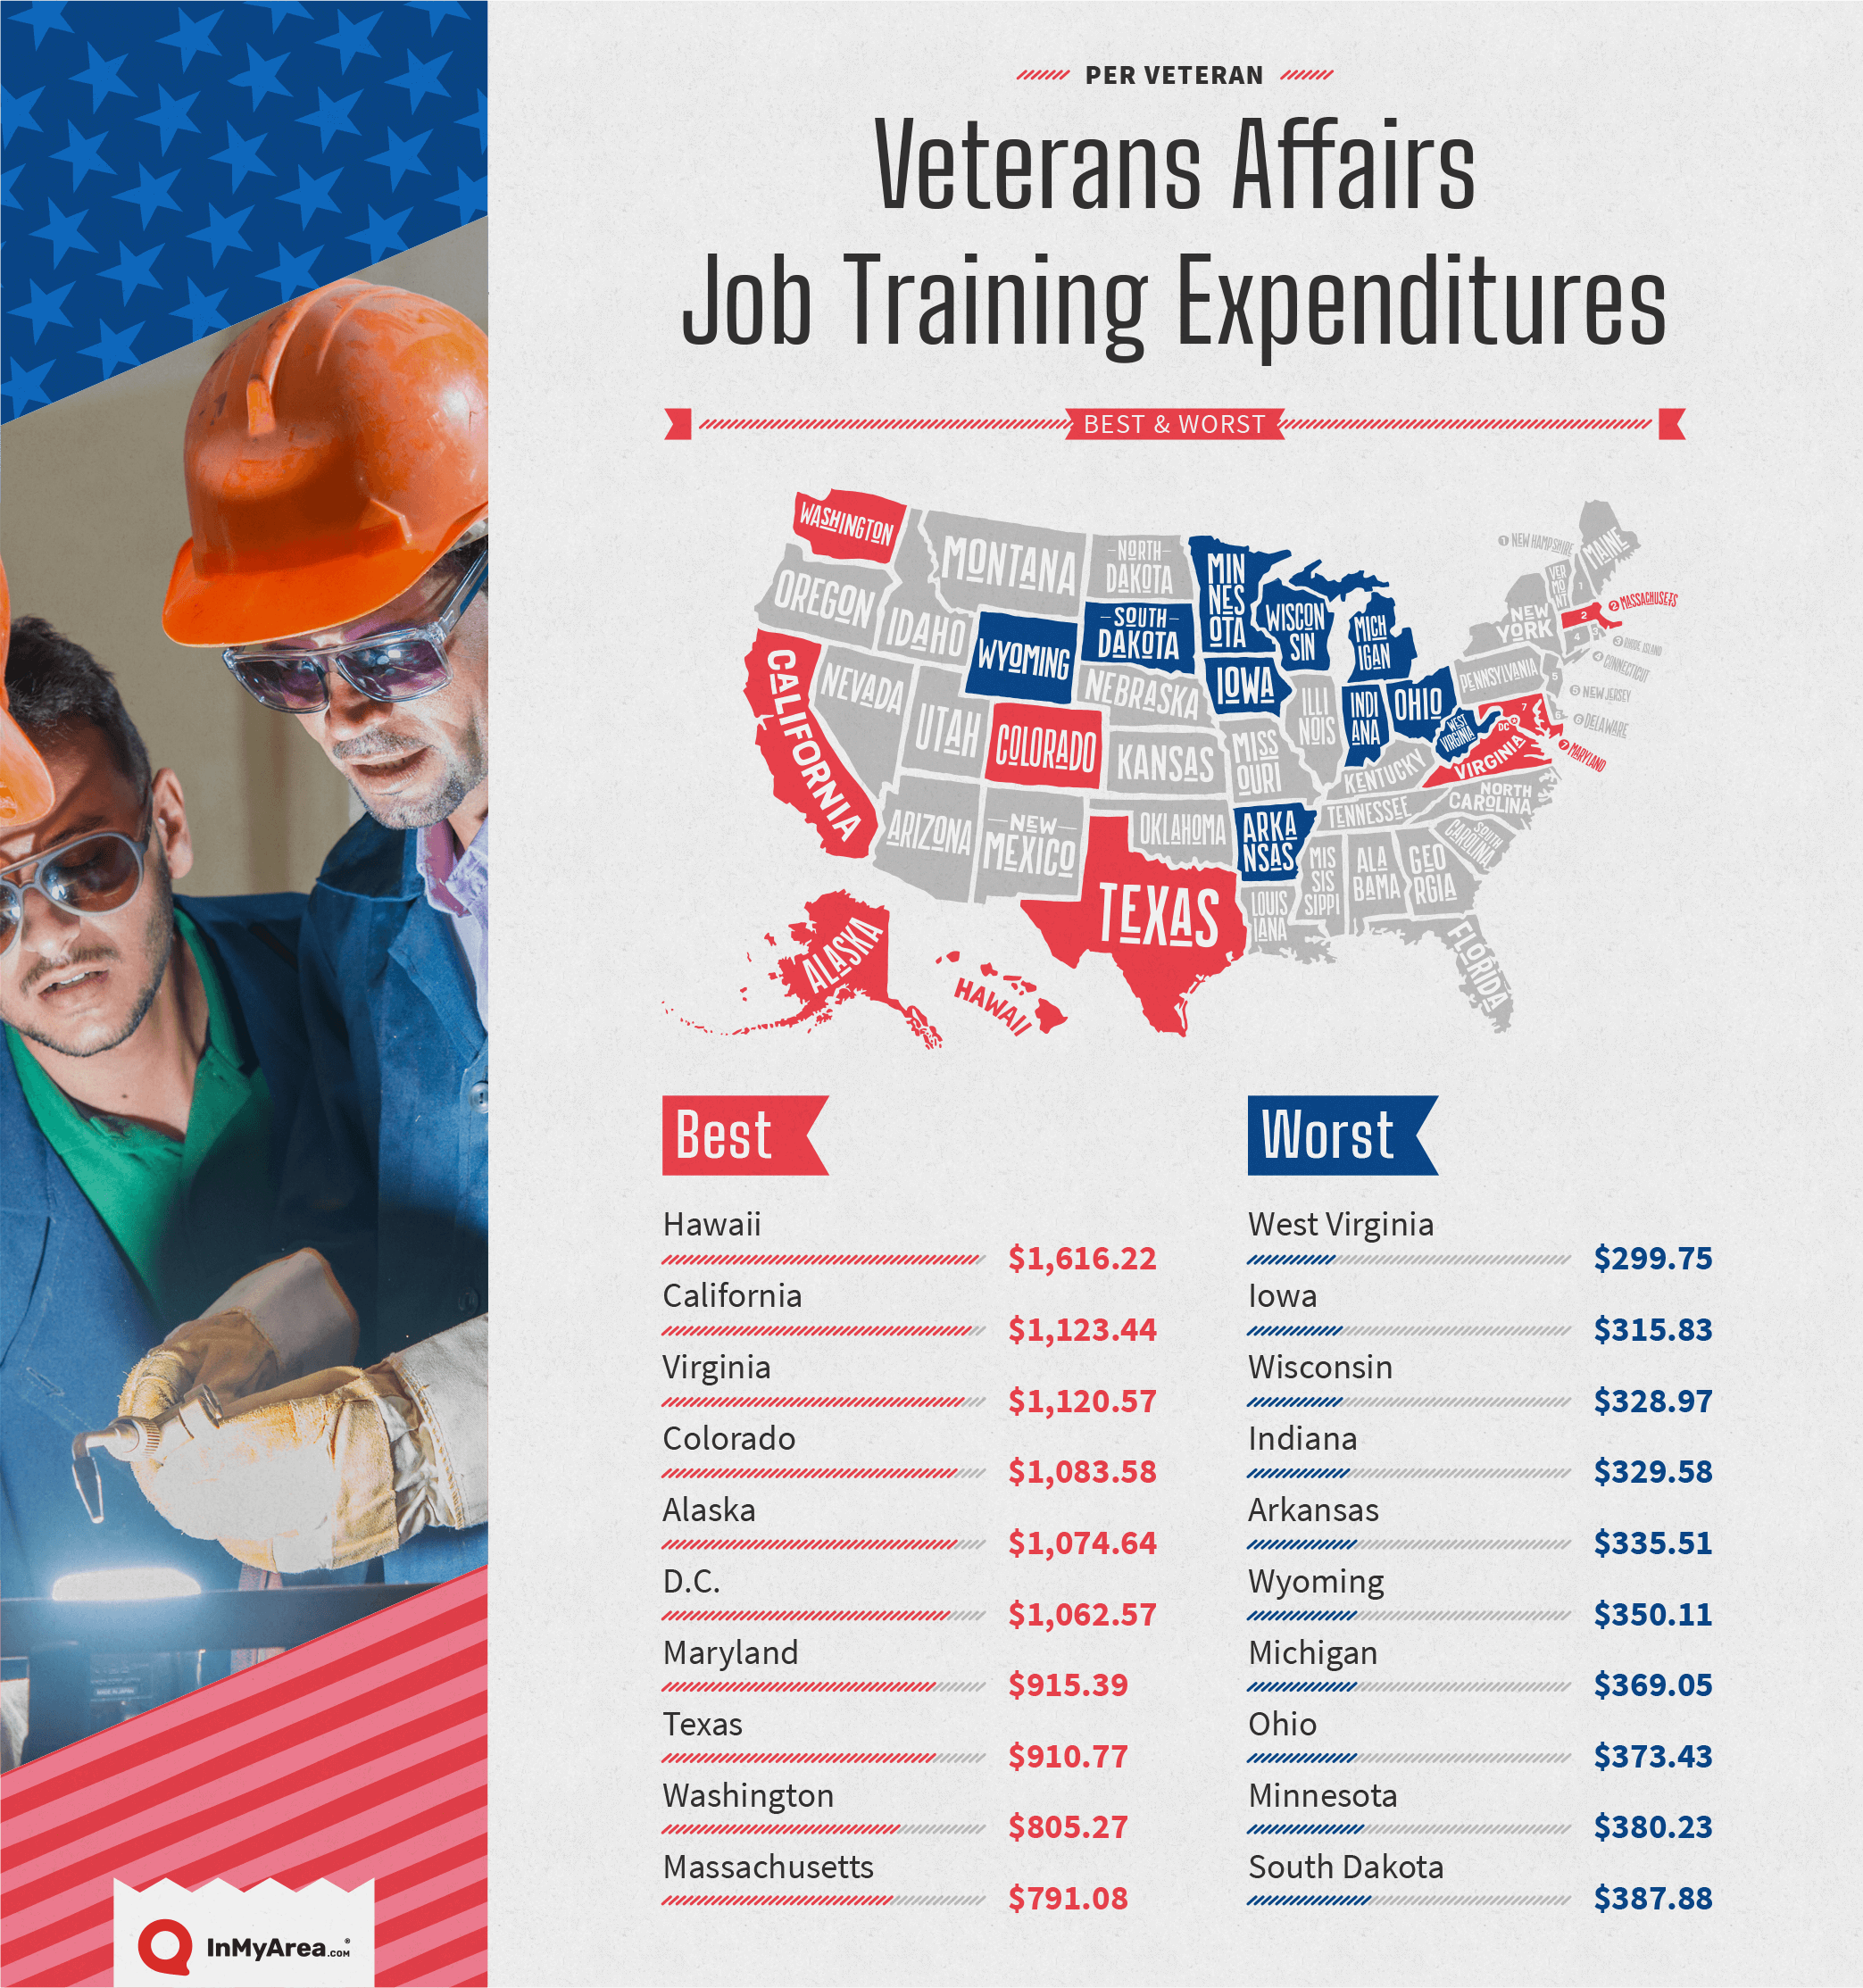
Job Training
The U.S. Department of Veterans Affairs spent more than $180 billion on various programs for veterans in fiscal year 2018, the most recent year for which the agency has published data. Medical care and pensions represent the largest share of this money (about 85%), but the third-largest chunk went to job training, employment services and vocational rehab.

What About Your State?
Curious to see the statistics from your state? Check out each state’s rates and metrics for each category included in our ranking, with the exception of absolute preference in civil service hiring (again, only four states use this method — Massachusetts, New Jersey, Pennsylvania and South Dakota).
Conclusion
The picture of a returning military veteran as a disaffected individual struggling to rejoin society and find gainful employment, while perhaps a reality at some points in American history, has largely been replaced by relatively low unemployment for veterans across the country. However, with millions of Americans on active duty, a concerted effort likely will still be needed in the years to come to ensure veterans’ lives are filled with the dignity they’re due thanks to their service.
Methodology
As we mentioned at the top, we compared all 50 states and the District of Columbia across several categories related to the employment of military veterans.
To calculate our overall index figure, we assigned a numerical value to each state relative to its ranking in each category. For example, Iowa’s annual veteran unemployment rate for 2018 was 1.4%, the best in the nation, so Iowa was assigned 51 points for that category (the highest possible score a state could receive in any category). Each state’s rank in the six scoring categories was then added together to create the overall tally.
Here’s a look at the categories included and where the data came from:
- Veterans preference points: Military.com
- Annual average unemployment rate for veterans, 2018 (most recent data) and 2014 and change over time: Bureau of Labor Statistics (2018 and 2014)
- Veterans’ median individual annual income, past 12 months: U.S. Census Bureau
- Veteran-owned business per 1,000 establishments: VeteranOwnedBusiness.com
- Veterans Affairs job training spending per veteran: VA.gov