[fusion_builder_container hundred_percent=”no” equal_height_columns=”no” menu_anchor=”” hide_on_mobile=”small-visibility,medium-visibility,large-visibility” class=”” id=”” background_color=”” background_image=”” background_position=”center center” background_repeat=”no-repeat” fade=”no” background_parallax=”none” enable_mobile=”no” parallax_speed=”0.3″ video_mp4=”” video_webm=”” video_ogv=”” video_url=”” video_aspect_ratio=”16:9″ video_loop=”yes” video_mute=”yes” video_preview_image=”” border_size=”” border_color=”” border_style=”solid” margin_top=”” margin_bottom=”” padding_top=”” padding_right=”” padding_bottom=”” padding_left=””][fusion_builder_row][fusion_builder_column type=”1_1″ layout=”1_1″ spacing=”” center_content=”no” hover_type=”none” link=”” min_height=”” hide_on_mobile=”small-visibility,medium-visibility,large-visibility” class=”” id=”” background_color=”” background_image=”” background_position=”left top” background_repeat=”no-repeat” border_size=”0″ border_color=”” border_style=”solid” border_position=”all” padding=”” dimension_margin=”” animation_type=”” animation_direction=”left” animation_speed=”0.3″ animation_offset=”” last=”no”][fusion_text]
Retirement is typically viewed as the end of the line — a time for rest, relaxation and the pursuit of interests long ago put on the back burner. But the story is far different for military retirees who must deal with the trials of re-assimilation into civilian life.
For starters, the average officer is only 45 years old — 42 for non-disability enlisted personnel — upon retirement from service. Many of those who reenter the job market face tough challenges during the transition while others struggle with more difficult problems, such as Post-Traumatic Stress Disorder, disability and homelessness.
As such, military retirement can be a far more complicated issue than one might assume, given the extent to which state tax policies on military benefits vary, the relative friendliness of different job markets toward veterans, and other socioeconomic factors. This year, the military’s retirement system is also changing for new recruits and current personnel who opt in, going from a “defined benefit” to a “Blended Retirement System” that awards funds not just based on years served but also matches contributions to a “Thrift Savings Plan.”
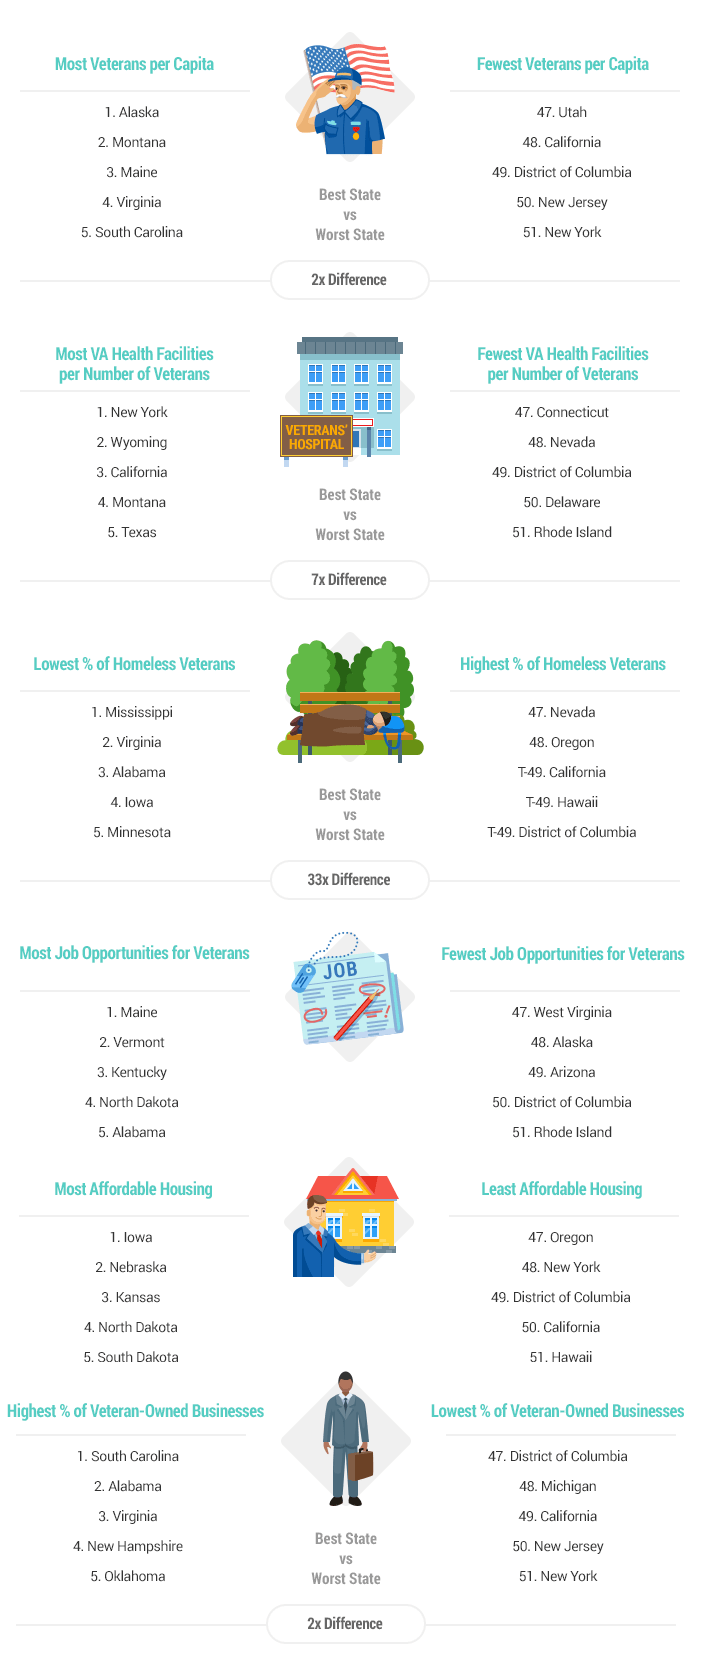
With that in mind, WalletHub sought to help ease the burden on our nation’s military community by comparing the 50 states and the District of Columbia based on their ability to provide a comfortable military retirement. Our analysis uses a data set of 27 key metrics, ranging from veterans per capita to number of VA health facilities to job opportunities for veterans. Read on for our findings, commentary from a panel of researchers and a full description of our methodology.
This study was conducted and published by WalletHub
[/fusion_text][/fusion_builder_column][/fusion_builder_row][/fusion_builder_container][fusion_builder_container hundred_percent=”no” equal_height_columns=”no” menu_anchor=”” hide_on_mobile=”small-visibility,medium-visibility,large-visibility” class=”” id=”” background_color=”” background_image=”” background_position=”center center” background_repeat=”no-repeat” fade=”no” background_parallax=”none” enable_mobile=”no” parallax_speed=”0.3″ video_mp4=”” video_webm=”” video_ogv=”” video_url=”” video_aspect_ratio=”16:9″ video_loop=”yes” video_mute=”yes” video_preview_image=”” border_size=”” border_color=”” border_style=”solid” margin_top=”” margin_bottom=”” padding_top=”” padding_right=”” padding_bottom=”” padding_left=””][fusion_builder_row][fusion_builder_column type=”1_1″ layout=”1_1″ spacing=”” center_content=”no” hover_type=”none” link=”” min_height=”” hide_on_mobile=”small-visibility,medium-visibility,large-visibility” class=”” id=”” background_color=”” background_image=”” background_position=”left top” background_repeat=”no-repeat” border_size=”0″ border_color=”” border_style=”solid” border_position=”all” padding=”” dimension_margin=”” animation_type=”” animation_direction=”left” animation_speed=”0.3″ animation_offset=”” last=”no”][fusion_text]
Main Findings
[/fusion_text][/fusion_builder_column][fusion_builder_column type=”1_3″ layout=”1_3″ spacing=”” center_content=”no” hover_type=”none” link=”” min_height=”” hide_on_mobile=”small-visibility,medium-visibility,large-visibility” class=”” id=”” background_color=”” background_image=”” background_position=”left top” background_repeat=”no-repeat” border_size=”0″ border_color=”” border_style=”solid” border_position=”all” padding=”” dimension_margin=”” animation_type=”” animation_direction=”left” animation_speed=”0.3″ animation_offset=”” last=”no”][fusion_code]Jmx0O2lmcmFtZSBzcmM9JnF1b3Q7Ly9kMmU3MGU5eWNlZDU3ZS5jbG91ZGZyb250Lm5ldC93YWxsZXRodWIvZW1iZWQvMzkxNS9nZW9jaGFydC1taWxpdGFyeS5odG1sJnF1b3Q7IHdpZHRoPSZxdW90OzU1NiZxdW90OyBoZWlnaHQ9JnF1b3Q7MzQ3JnF1b3Q7IGZyYW1lQm9yZGVyPSZxdW90OzAmcXVvdDsgc2Nyb2xsaW5nPSZxdW90O25vJnF1b3Q7Jmd0OyZsdDsvaWZyYW1lJmd0OwombHQ7ZGl2IHN0eWxlPSZxdW90O3dpZHRoOjU1NnB4O2ZvbnQtc2l6ZToxMnB4O2NvbG9yOiM4ODg7JnF1b3Q7Jmd0O1NvdXJjZTogJmx0O2EgaHJlZj0mcXVvdDtodHRwczovL3dhbGxldGh1Yi5jb20vZWR1L2Jlc3Qtc3RhdGVzLWZvci1taWxpdGFyeS1yZXRpcmVlcy8zOTE1LyZxdW90OyZndDtXYWxsZXRIdWImbHQ7L2EmZ3Q7Jmx0Oy9kaXYmZ3Q7[/fusion_code][/fusion_builder_column][fusion_builder_column type=”1_3″ layout=”1_3″ spacing=”” center_content=”no” hover_type=”none” link=”” min_height=”” hide_on_mobile=”small-visibility,medium-visibility,large-visibility” class=”” id=”” background_color=”” background_image=”” background_position=”left top” background_repeat=”no-repeat” border_size=”0″ border_color=”” border_style=”solid” border_position=”all” padding=”” dimension_margin=”” animation_type=”” animation_direction=”left” animation_speed=”0.3″ animation_offset=”” last=”no” element_content=””][/fusion_builder_column][fusion_builder_column type=”1_3″ layout=”1_3″ spacing=”” center_content=”no” hover_type=”none” link=”” min_height=”” hide_on_mobile=”small-visibility,medium-visibility,large-visibility” class=”” id=”” background_color=”” background_image=”” background_position=”left top” background_repeat=”no-repeat” border_size=”0″ border_color=”” border_style=”solid” border_position=”all” padding=”” dimension_margin=”” animation_type=”” animation_direction=”left” animation_speed=”0.3″ animation_offset=”” last=”no” element_content=””][/fusion_builder_column][/fusion_builder_row][/fusion_builder_container][fusion_builder_container hundred_percent=”no” equal_height_columns=”no” menu_anchor=”” hide_on_mobile=”small-visibility,medium-visibility,large-visibility” class=”” id=”” background_color=”” background_image=”” background_position=”center center” background_repeat=”no-repeat” fade=”no” background_parallax=”none” enable_mobile=”no” parallax_speed=”0.3″ video_mp4=”” video_webm=”” video_ogv=”” video_url=”” video_aspect_ratio=”16:9″ video_loop=”yes” video_mute=”yes” video_preview_image=”” border_size=”” border_color=”” border_style=”solid” margin_top=”” margin_bottom=”” padding_top=”” padding_right=”” padding_bottom=”” padding_left=””][fusion_builder_row][fusion_builder_column type=”1_1″ layout=”1_1″ spacing=”” center_content=”no” hover_type=”none” link=”” min_height=”” hide_on_mobile=”small-visibility,medium-visibility,large-visibility” class=”” id=”” background_color=”” background_image=”” background_position=”left top” background_repeat=”no-repeat” border_size=”0″ border_color=”” border_style=”solid” border_position=”all” padding=”” dimension_margin=”” animation_type=”” animation_direction=”left” animation_speed=”0.3″ animation_offset=”” last=”no”][fusion_text]
Best States for Military Retirees
| Overall Rank (1=Best) |
State | Total Score | ‘Economic Environment’ Rank | ‘Quality of Life’ Rank | ‘Health Care’ Rank |
|---|---|---|---|---|---|
| 1 | Florida | 61.55 | 9 | 5 | 13 |
| 2 | Virginia | 60.18 | 3 | 1 | 39 |
| 3 | New Hampshire | 59.87 | 8 | 9 | 10 |
| 4 | Alabama | 58.86 | 1 | 14 | 30 |
| 5 | South Carolina | 58.84 | 15 | 4 | 23 |
| 6 | Maine | 58.83 | 2 | 21 | 16 |
| 7 | South Dakota | 58.64 | 12 | 40 | 1 |
| 8 | Alaska | 58.24 | 17 | 2 | 28 |
| 9 | Idaho | 57.45 | 24 | 31 | 2 |
| 10 | Texas | 55.29 | 5 | 27 | 24 |
| 11 | Montana | 55.02 | 41 | 13 | 3 |
| 12 | Minnesota | 54.72 | 30 | 25 | 5 |
| 13 | Massachusetts | 54.70 | 4 | 49 | 7 |
| 14 | Kentucky | 54.02 | 10 | 41 | 11 |
| 15 | Oklahoma | 53.66 | 21 | 8 | 36 |
| 16 | Louisiana | 53.51 | 14 | 30 | 19 |
| 17 | Wyoming | 53.50 | 29 | 6 | 40 |
| 18 | North Dakota | 52.92 | 36 | 33 | 8 |
| 19 | Missouri | 52.91 | 19 | 19 | 22 |
| 20 | Wisconsin | 52.71 | 32 | 24 | 14 |
| 21 | North Carolina | 52.46 | 31 | 12 | 25 |
| 22 | Georgia | 52.37 | 13 | 20 | 38 |
| 23 | Ohio | 52.11 | 25 | 38 | 9 |
| 24 | Pennsylvania | 52.07 | 43 | 26 | 4 |
| 25 | Utah | 51.93 | 6 | 45 | 26 |
| 26 | Arizona | 51.12 | 38 | 11 | 27 |
| 27 | Maryland | 50.99 | 16 | 3 | 51 |
| 28 | Kansas | 50.64 | 20 | 22 | 33 |
| 29 | Arkansas | 50.54 | 34 | 34 | 18 |
| 30 | Michigan | 50.07 | 27 | 46 | 12 |
| 31 | Washington | 49.83 | 11 | 36 | 44 |
| 32 | Nebraska | 49.69 | 45 | 17 | 15 |
| 33 | Colorado | 49.64 | 37 | 18 | 32 |
| 34 | Connecticut | 49.60 | 42 | 16 | 29 |
| 35 | West Virginia | 49.36 | 18 | 37 | 35 |
| 36 | California | 49.00 | 48 | 10 | 17 |
| 37 | Hawaii | 48.75 | 23 | 29 | 43 |
| 38 | Tennessee | 47.93 | 7 | 47 | 41 |
| 39 | Illinois | 47.44 | 40 | 42 | 21 |
| 40 | Iowa | 47.10 | 33 | 23 | 47 |
| 41 | Delaware | 47.06 | 49 | 7 | 42 |
| 42 | Indiana | 46.87 | 28 | 44 | 34 |
| 43 | Mississippi | 46.60 | 22 | 32 | 49 |
| 44 | Rhode Island | 46.16 | 44 | 39 | 20 |
| 45 | New Jersey | 45.48 | 46 | 15 | 46 |
| 46 | New York | 45.32 | 51 | 43 | 6 |
| 47 | New Mexico | 45.17 | 39 | 28 | 48 |
| 48 | Nevada | 43.47 | 26 | 48 | 45 |
| 49 | Vermont | 43.15 | 50 | 35 | 31 |
| 50 | Oregon | 39.90 | 35 | 51 | 37 |
| 51 | District of Columbia | 37.05 | 47 | 50 | 50 |
[/fusion_text][/fusion_builder_column][/fusion_builder_row][/fusion_builder_container][fusion_builder_container hundred_percent=”no” equal_height_columns=”no” menu_anchor=”” hide_on_mobile=”small-visibility,medium-visibility,large-visibility” class=”” id=”” background_color=”” background_image=”” background_position=”center center” background_repeat=”no-repeat” fade=”no” background_parallax=”none” enable_mobile=”no” parallax_speed=”0.3″ video_mp4=”” video_webm=”” video_ogv=”” video_url=”” video_aspect_ratio=”16:9″ video_loop=”yes” video_mute=”yes” video_preview_image=”” border_size=”” border_color=”” border_style=”solid” margin_top=”” margin_bottom=”” padding_top=”” padding_right=”” padding_bottom=”” padding_left=””][fusion_builder_row][fusion_builder_column type=”1_1″ layout=”1_1″ spacing=”” center_content=”no” hover_type=”none” link=”” min_height=”” hide_on_mobile=”small-visibility,medium-visibility,large-visibility” class=”” id=”” background_color=”” background_image=”” background_position=”left top” background_repeat=”no-repeat” border_size=”0″ border_color=”” border_style=”solid” border_position=”all” padding=”” dimension_margin=”” animation_type=”” animation_direction=”left” animation_speed=”0.3″ animation_offset=”” last=”no”][fusion_text]
Methodology
In order to determine the best and worst states for military retirement, WalletHub compared the 50 states and the District of Columbia across three key dimensions: 1) Economic Environment, 2) Quality of Life and 3) Health Care.
We evaluated those dimensions using 27 relevant metrics, which are listed below with their corresponding weights. Each metric was graded on a 100-point scale, with a score of 100 representing the most favorable conditions for military retirees. For metrics marked with an asterisk (*), we measured the “number of veterans” by the square root of the veteran population in order to avoid overcompensating for small differences among states, considering Veterans Administration (VA) facilities have not increased proportionally with the number of veterans.
We then determined each state and the District’s weighted average across all metrics to calculate its overall score and used the resulting scores to rank-order our sample.
Economic Environment – Total Points: 33.33
- State Tax on Military Pension: Triple Weight (~5.56 Points)
- Tax-Friendliness: Full Weight (~1.85 Points)
Note: This metric is based on WalletHub’s Tax Rates by State report. - Share of Veteran-Owned Businesses: Full Weight (~1.85 Points)
- Dollars in Defense Department Contracts per Capita: Full Weight (~1.85 Points)
- Job Opportunities for Veterans: Triple Weight (~5.56 Points)
- State Authorization for Veterans’ Preference in Private Hiring: Full Weight (~1.85 Points)
Note: This binary metric considers the presence or absence of a state statute authorizing private employers to implement a veteran-employment preference without vulnerability to claims of discrimination. - Veteran Job Fairs per 100,000 Veterans: Full Weight (~1.85 Points)
- Job Growth (2017 vs. 2016): Full Weight (~1.85 Points)
- Military Bases & Installations per 100,000 Veterans: Full Weight (~1.85 Points)
- Total VA Expenditure per Number of Veterans: Full Weight (~1.85 Points)
- Presence of State Help for Returning Veterans: Full Weight (~1.85 Points)
Note: This binary metric considers the presence or absence of veteran transition programs & commissions in a state. - Presence of Academic Credit for Military Service: Full Weight (~1.85 Points)
Note: This binary metric considers the presence or absence of state legislation recognizing the varied skills and knowledge veterans acquire by counting it toward college credit. - Housing Affordability: Full Weight (~1.85 Points)
- Cost-of-Living Index: Full Weight (~1.85 Points)
Quality of Life – Total Points: 33.33
- Share of Veterans: Full Weight (~3.51 Points)
- Share of Veterans Not Receiving SNAP: Full Weight (~3.51 Points)
- Share of VA Benefits-Administration Facilities per Number of Veterans*: Double Weight (~7.02 Points)
- Quality of University System: Full Weight (~3.51 Points)
Note: This metric is based on WalletHub 2018’s College & University Rankings - Arts, Leisure & Recreation Establishments per Capita: Half Weight (~1.75 Points)
- Share of Population Aged 40 & Older: Full Weight (~3.51 Points)
- Share of Homeless Veterans: Double Weight (~7.02 Points)
- Idealness of Weather: Full Weight (~3.51 Points)
Note: This metric is based on WalletHub’s Cities with the Best & Worst Weather ranking.
Health Care – Total Points: 33.33
- Number of VA Health Facilities per Number of Veterans*: Full Weight (~4.76 Points)
- Federal, State, Local & Private Hospitals per Capita: Full Weight (~4.76 Points)
- Physicians per Capita: Full Weight (~4.76 Points)
- Quality of VA Hospitals: Triple Weight (~14.28 Points)
Note: This composite metric includes:
a) “Patients’ Willingness to Recommend the Veteran Hospitals” score from the U.S. Department of Veterans Affairs’ “Hospital Report Card”
b) VA hospital performance star rating from the U.S. Department of Veterans Affairs’ “Strategic Analytics for Improvement and Learning” (SAIL) performance improvement tool - Presence of Veteran-Treatment Courts: Full Weight (~4.76 Points)
Note: This metric considers the presence or absence of veteran-treatment courts, programs that provide treatment and mentoring services to veterans with mental-health and substance-abuse problems in order to keep them out of the criminal justice system and help stabilize their lives.
Sources: Data used to create this ranking were collected from the U.S. Census Bureau, Bureau of Labor Statistics, Military Officers Association of America, USAspending.gov, U.S. Department of Veterans Affairs, MilitaryINSTALLATIONS – U.S. Department of Defense, RecruitMilitary, National Conference of State Legislatures, Center on Budget and Policy Priorities, Council for Community and Economic Research, U.S. Department of Housing and Urban Development, Indeed and WalletHub research.
READ NEXT: JOBS FOR VETERANS IN INFORMATION SECURITY ARE GROWING RAPIDLY
 [/fusion_text][/fusion_builder_column][/fusion_builder_row][/fusion_builder_container]